


Premium Fundamental Analysis Course #0: How Warren Buffett Analizes Stocks — A Deep Dive into Apple
Premium Fundamental Analysis Course #0: How Warren Buffett Analizes Stocks — A Deep Dive into Apple

Hello friends,
If you like my writing, please consider liking and restacking this post!
For the Fundamental Analysis course we are using data from TradingView.
You can use their 30-day trial and later 60% off offer on the annual plan. To leverage all the tools we use, you need to get the Premium tier plan.

In the world of investing, few names carry as much weight as Warren Buffett. His ability to quickly and accurately assess the value of a company has made him one of the most successful investors of all time.
This lesson will delve deep into Buffett's methodology, providing you with advanced techniques to rapidly analyze any stock using fundamental analysis.

TradingView has a screener option where you can find all companies and filter them by their fundamentals.
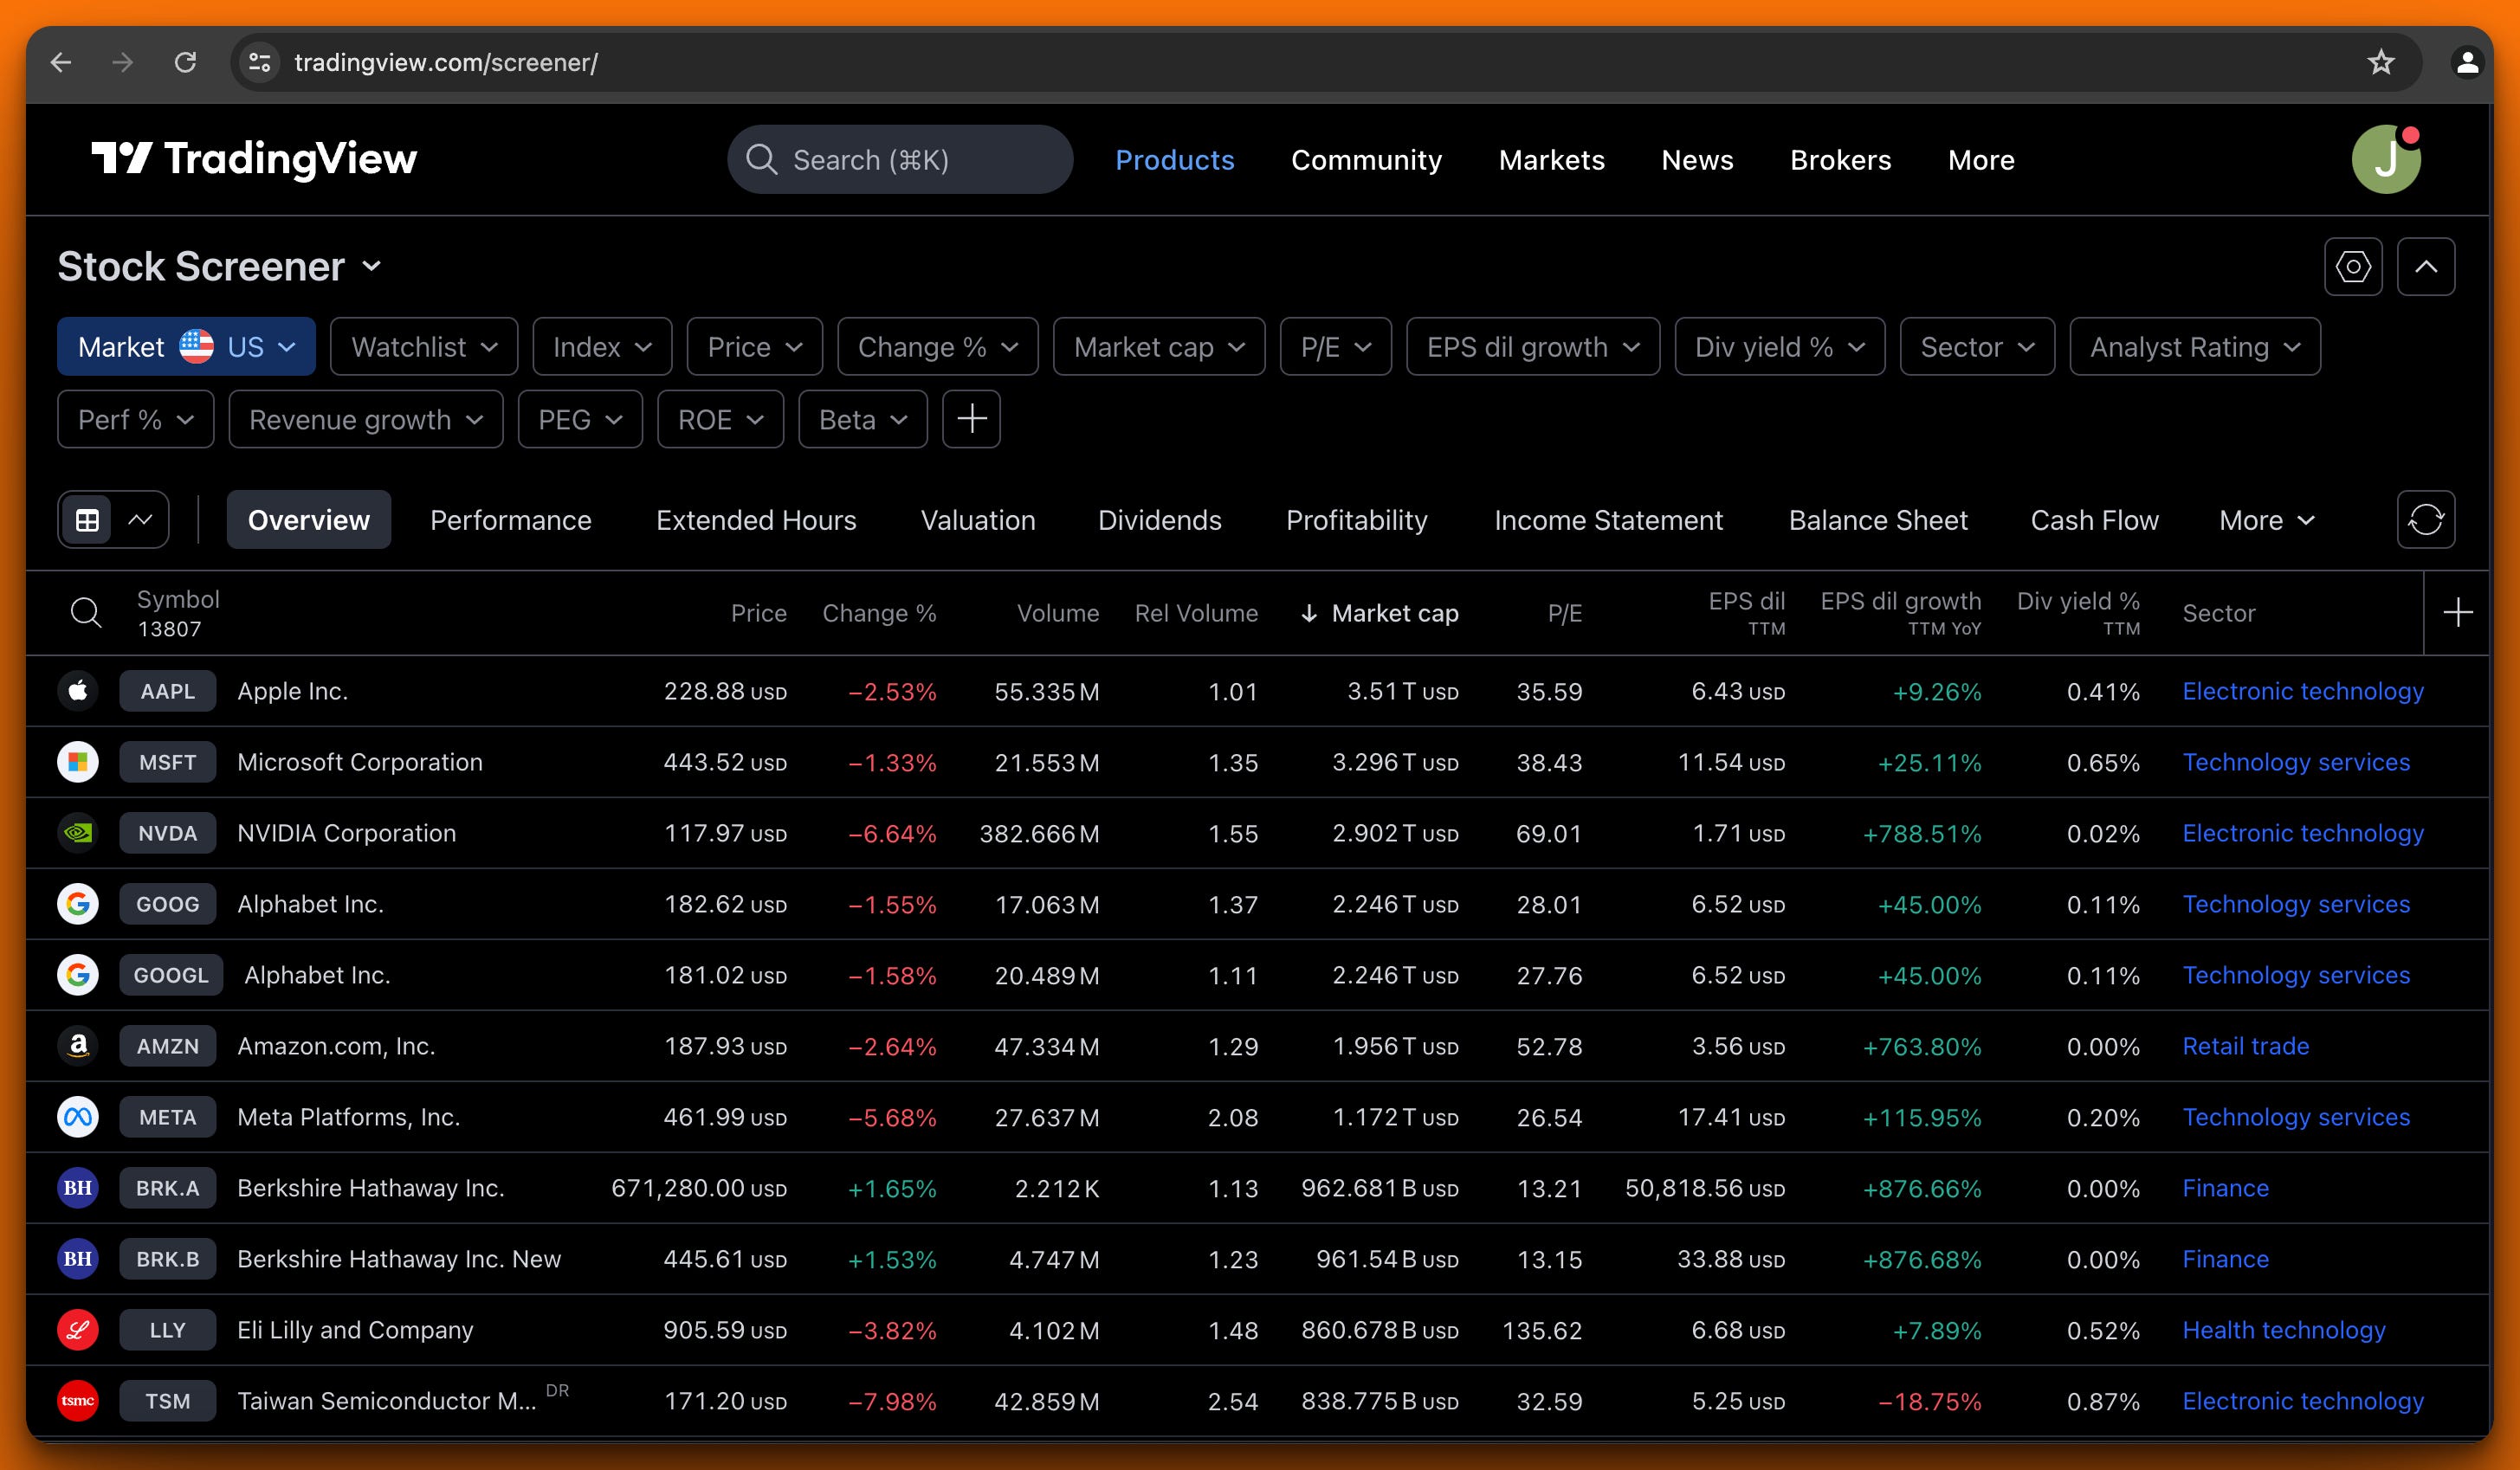
Once you choose company to analyze you can see its detailed fundamentals:
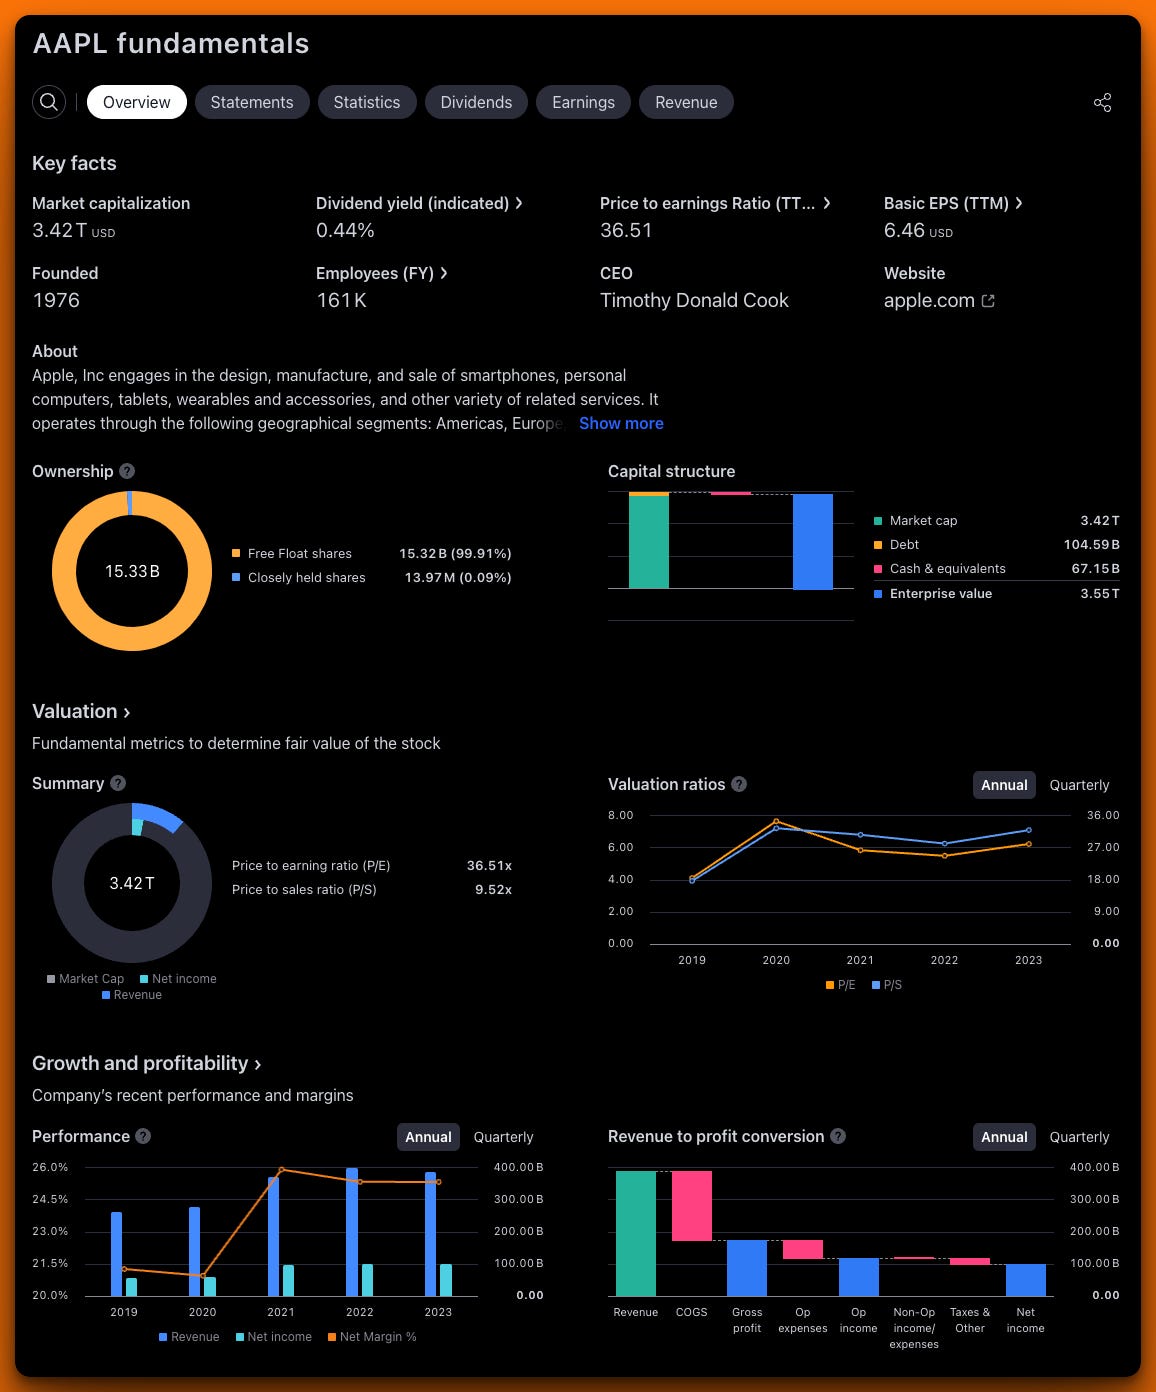
Warren Buffett-Style Comprehensive Analysis of Apple Inc. (AAPL)
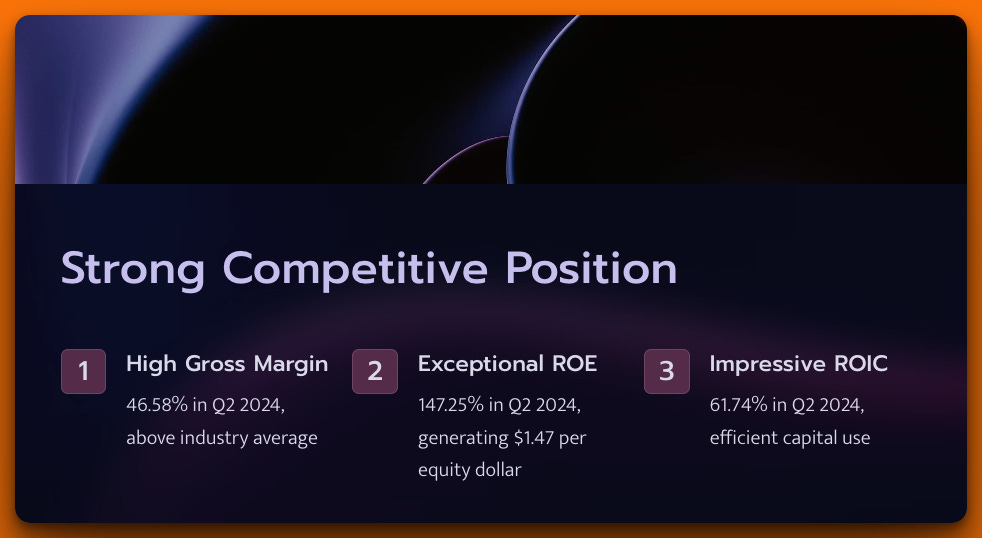
1. Competitive Position (Durable Competitive Advantage)
Apple's competitive position remains exceptionally strong, as evidenced by its financial metrics:
Gross Margin: 46.58% (Q2 2024)
Return on Equity (ROE): 147.25% (Q2 2024)
Return on Invested Capital (ROIC): 61.74% (Q2 2024)
These high margins and returns indicate a robust competitive advantage, or what Buffett calls an "economic moat." Let's break this down:
Gross Margin
Apple's gross margin of 46.58% is significantly higher than the industry average, which typically hovers around 20-30% for consumer electronics companies. This indicates strong pricing power and efficient production, likely due to Apple's brand strength and economies of scale.
Return on Equity (ROE)
An ROE of 147.25% is exceptionally high. This means Apple is generating $1.47 in profit for every dollar of shareholder equity. For context, an ROE above 20% is generally considered excellent. Apple's astronomical ROE suggests not only high profitability but also efficient use of equity, possibly through share buybacks.
Return on Invested Capital (ROIC)
The ROIC of 61.74% is also remarkably high. This metric shows how well a company generates cash flow relative to the capital invested in its business. An ROIC above 15% is typically considered very good, so Apple's figure indicates an extraordinarily efficient use of capital.
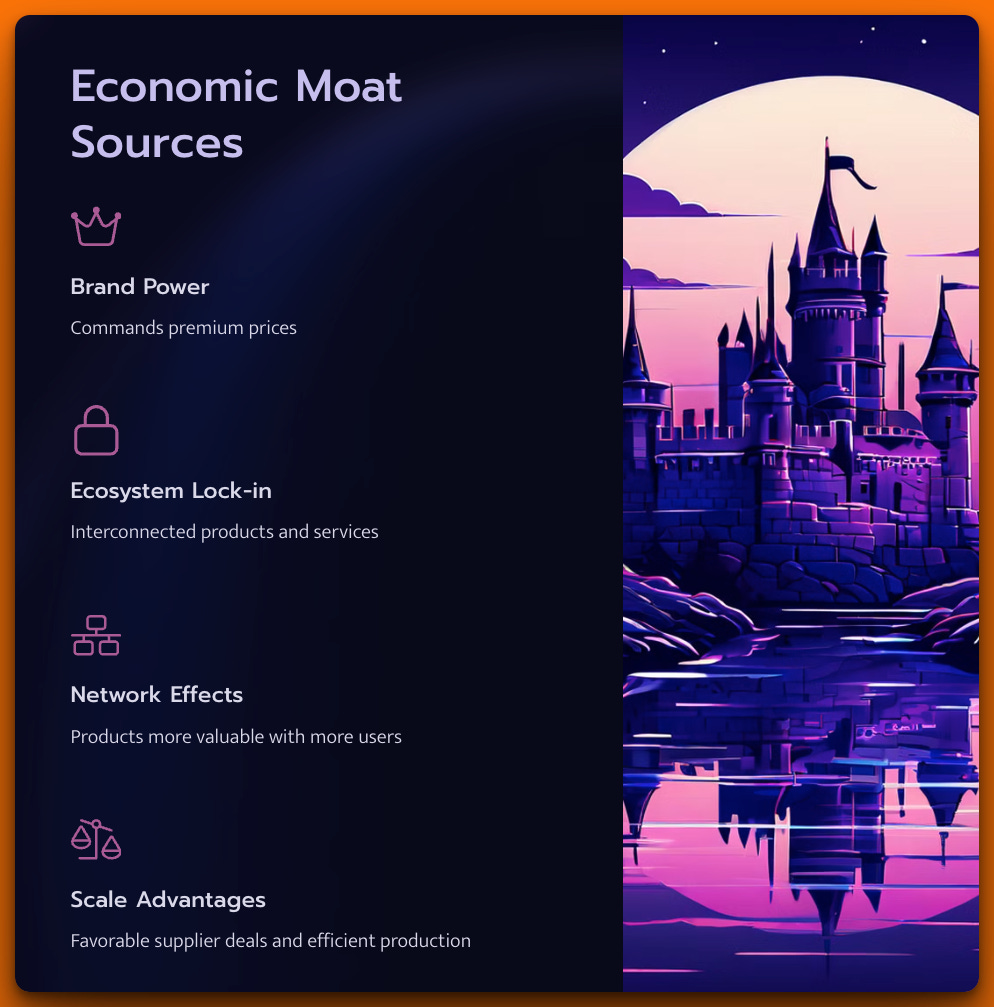
These metrics collectively suggest that Apple has a wide and deep economic moat, likely stemming from several sources:
Brand Power: Apple's brand allows it to command premium prices.
Ecosystem Lock-in: The interconnectedness of Apple's products and services makes it difficult for customers to switch.
Network Effects: As more people use Apple products, they become more valuable (e.g., iMessage, FaceTime).
Scale Advantages: Apple's size allows for favorable deals with suppliers and efficient production.
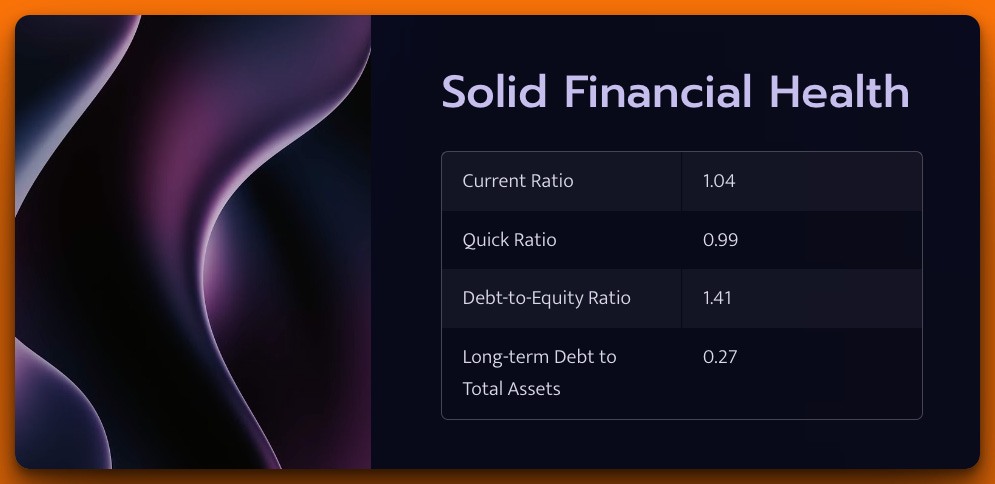
2. Financial Health
Apple's balance sheet appears solid:
Current Ratio: 1.04 (Q2 2024)
Quick Ratio: 0.99 (Q2 2024)
Debt-to-Equity Ratio: 1.41 (Q2 2024)
Long-term Debt to Total Assets: 0.27 (Q2 2024)
Let's analyze these in detail:
Liquidity Ratios
The current ratio of 1.04 and quick ratio of 0.99 indicate that Apple can comfortably meet its short-term obligations. While these ratios are lower than the often-cited "ideal" of 2.0, for a company of Apple's size and cash flow generation, they're more than adequate. Apple's ability to quickly convert inventory to cash means it can operate efficiently with lower liquidity ratios.
Debt Ratios
The debt-to-equity ratio of 1.41 might seem high at first glance, but it's important to consider Apple's cash position and cash flow generation. As of the latest balance sheet, Apple had $67.15B in cash and cash equivalents. The long-term debt to total assets ratio of 0.27 provides a more balanced view, showing that only about a quarter of Apple's assets are financed by long-term debt.
For context, let's calculate Apple's interest coverage ratio:
Operating Income (TTM): $118.24B
Interest Expense (estimated at 3% of long-term debt): $3.14B
Interest Coverage Ratio: 118.24 / 3.14 = 37.66
This means Apple's operating income could cover its interest expenses 37 times over, indicating very low risk of financial distress.
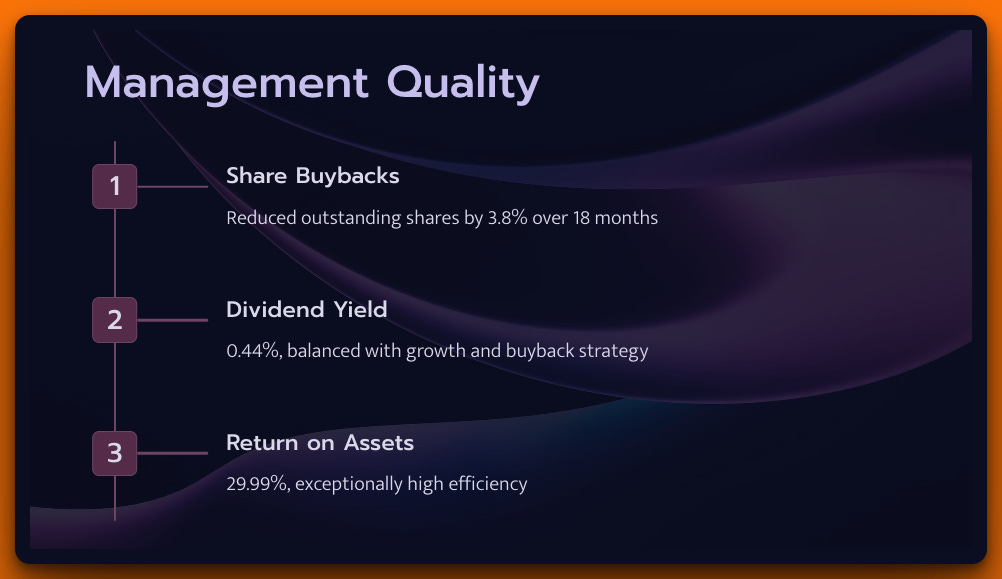
3. Management Quality
We can assess management quality through capital allocation and returns:
Share Buybacks: Total common shares outstanding decreased from 15.94B in Q4 2022 to 15.33B in Q2 2024
Dividend Yield: 0.44%
Return on Assets: 29.99% (Q2 2024)
Capital Allocation
Apple's management, led by CEO Tim Cook, has shown a strong commitment to returning capital to shareholders. The consistent share buybacks have reduced the share count by about 3.8% over 18 months, effectively increasing each shareholder's ownership stake.
The relatively low dividend yield of 0.44% might seem underwhelming, but it's important to consider this in the context of Apple's growth and buyback strategy. Apple is balancing returning capital to shareholders with maintaining flexibility for investments and acquisitions.
Efficiency
The Return on Assets of 29.99% is exceptionally high, indicating that management is very efficient at using the company's assets to generate profits. For perspective, an ROA above 5% is generally considered good.
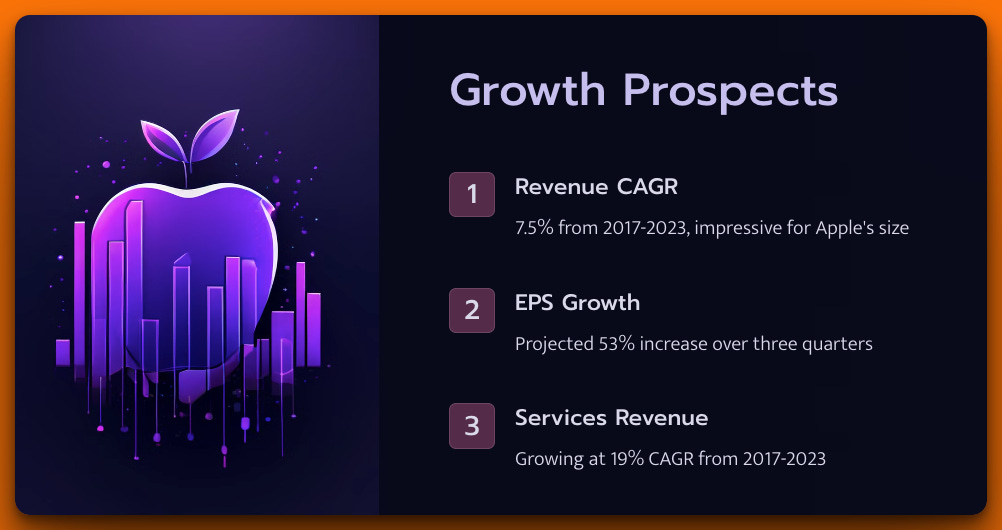
4. Growth Prospects
Apple's growth prospects remain positive:
Revenue CAGR (2017-2023): ~7.5%
EPS Growth: Projected to grow from 1.53 in Q2 2024 to 2.34 in Q1 2025
Services Revenue: Growing from $29.98B in 2017 to $85.20B in 2023
Revenue Growth
While a 7.5% CAGR might not seem explosive, it's impressive for a company of Apple's size. Growing from a base of hundreds of billions of dollars is challenging, and this steady growth rate indicates Apple's ability to continue expanding its market.
EPS Growth
The projected EPS growth from 1.53 to 2.34 (a 53% increase) over three quarters is significant. This could be driven by a combination of revenue growth, margin expansion, and share buybacks.
Diversification
The growth in Services revenue is particularly noteworthy. This segment has grown at a CAGR of about 19% from 2017 to 2023, much faster than overall revenue. This shift towards higher-margin, recurring revenue streams is a key part of Apple's future growth strategy.
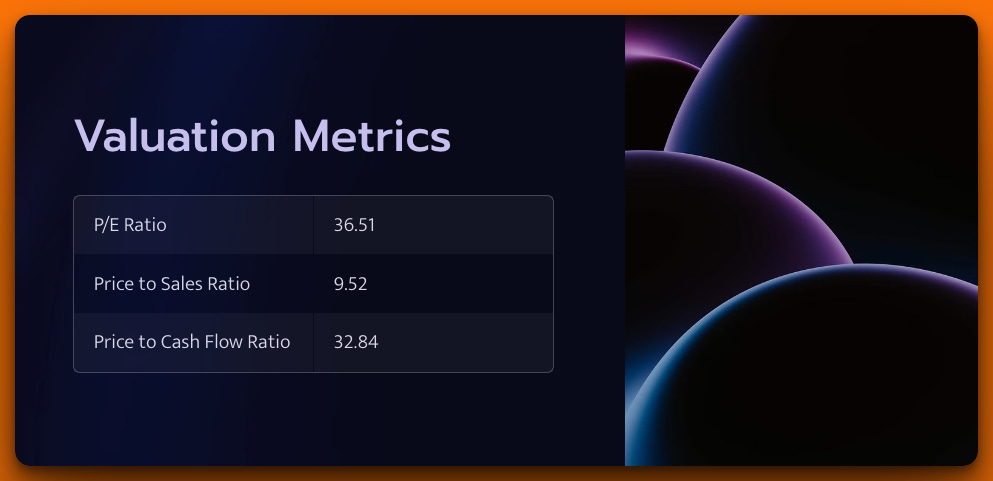
5. Valuation
As of the latest data:
P/E Ratio: 36.51
Price to Sales Ratio: 9.52
Price to Cash Flow Ratio: 32.84
These multiples are high compared to the broader market, reflecting the premium investors are willing to pay for Apple's quality and growth prospects. However, Buffett often emphasizes that it's better to buy a wonderful company at a fair price than a fair company at a wonderful price.
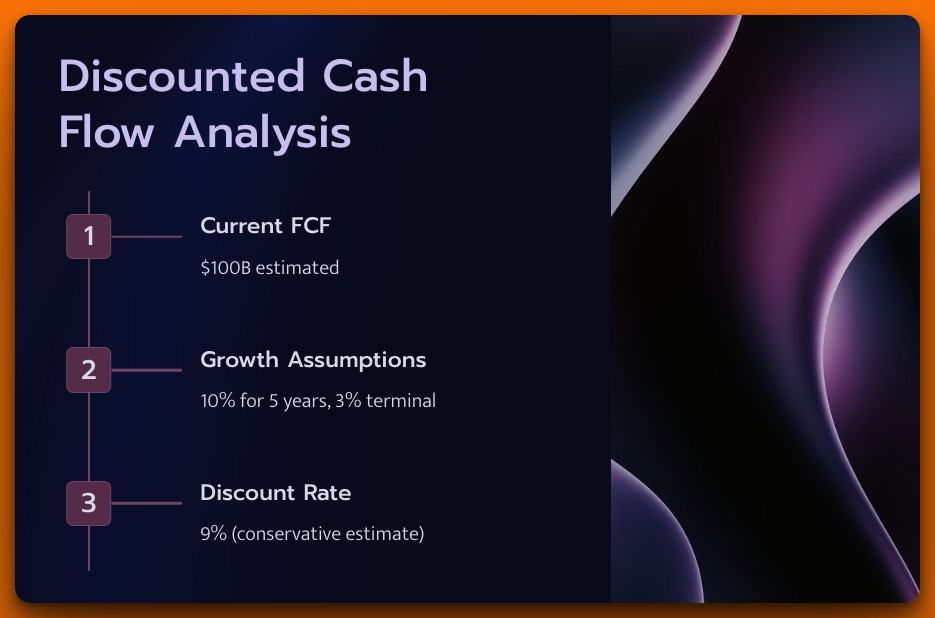
Let's perform a discounted cash flow (DCF) analysis:
Current Free Cash Flow (FCF): $100B (estimated based on net income of $100.39B TTM)
Growth rate: 10% for 5 years, then 3% terminal growth
Discount rate: 9% (slightly higher than WACC to be conservative)
Estimated Intrinsic Value:
Year 1-5 FCF: $110B, $121B, $133.1B, $146.4B, $161.1B
Terminal Value: ($161.1B * 1.03) / (0.09 - 0.03) = $2,765B
Sum of discounted cash flows: ~$2,500B
Less net debt: $2,500B - $37.44B = $2,462.56B
Divide by shares outstanding (15.33B): $160.64 per share
With the current stock price at $223.55, this suggests Apple is trading above its intrinsic value. However, this model is sensitive to assumptions. If we believe Apple can grow FCF at 12% for the next 5 years instead of 10%, the intrinsic value jumps to $189 per share.
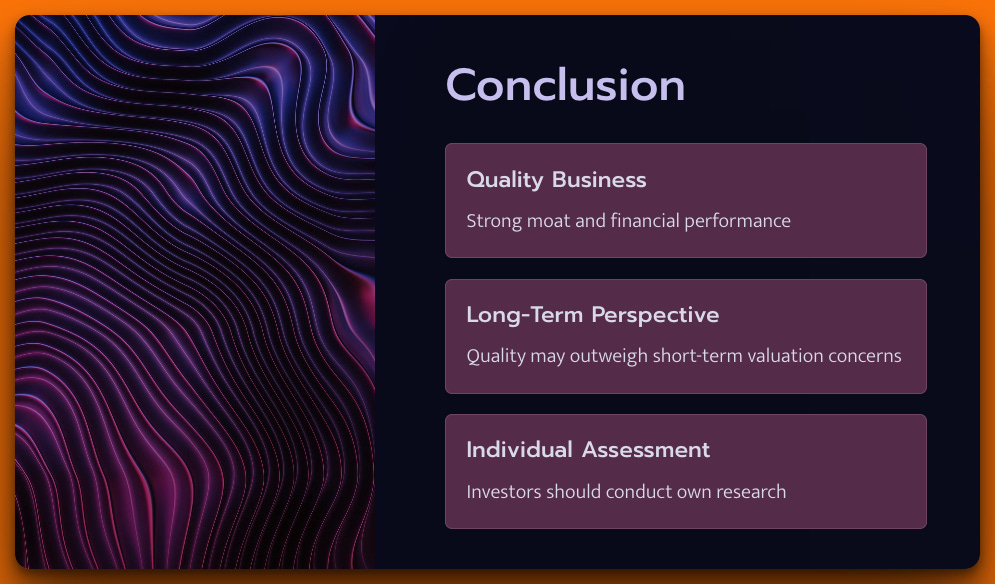
Conclusion
Apple demonstrates many qualities that Buffett values:
A strong competitive position with high returns on capital
Solid financial health with manageable debt
Quality management with shareholder-friendly capital allocation
Good growth prospects, particularly in high-margin services
A powerful brand and ecosystem that provide a wide economic moat
While the current valuation appears high based on our DCF analysis, Buffett's long-term perspective and appreciation for quality businesses might still make Apple an attractive investment in his view.
In Buffett's approach, the quality of the business often trumps short-term valuation concerns, especially for a company with Apple's competitive advantages and financial strength.
However, as always, potential investors should conduct their own thorough research and consider their individual financial situations and risk tolerance before making investment decisions.

Now, I understand that these things might seem complex to beginners and this is why I’m here.
In the next lessons I will break down Fundamental Analysis into smaller chunks and explain it so that you understand what’s really standing behind these numbers and concepts.

Here's to buying low and selling high!
Jack from the Daily Moat
Great deep dive into Apple using the Buffett lens. You've really channeled the Oracle of Omaha here!.
I particularly appreciate your nuanced take on Apple's liquidity ratios. You're right - for a cash cow like Apple, the standard benchmarks don't always apply. It's all about context.
Your DCF analysis is a nice touch. It's always good to see the numbers, even if, as Buffett would say, it's better to be approximately right than precisely wrong.