Market Timing Masterclass from MktContext + 5 Stock Picks
Bonus: why we think IWM is poised to continue running
Hello! We are MktContext and we’ve been beating the market since 2014.
I am a professional money manager, trader, and investor. I’ve managed $5B AUM at a major bank. I focus on timing the market - yes, it’s possible! We explain how in my weekly letter at MktContext.com, where we give you the analysis and tools to do the same. Come check us out and sign up for free!
✅ Here’s our past note where we called the market top by using a SINGLE indicator.
✅ And we predicted the pattern of this week’s selloff before it happened.
Our approach - Why do we trade our portfolio?
We often get asked why we trade in and out of our entire portfolio (sometimes getting whipsawed!) instead of just holding for the long run. There is well-documented evidence that market timing can outperform a simple buy-and-hold strategy. This is how we’ve managed to beat the market for nearly a decade.
By swinging our portfolio at opportune times, sometimes going into 100% cash, we can stay 100% invested in equities most of the time. This allows us to capture the high returns that this asset class has historically offered, without the significant drawdowns that it periodically suffers.
The typical stock/bond portfolio’s returns are significantly dragged down by the bond portion. Historically, bonds were needed to protect on the downside. But if we can find other ways to protect us, then we can remove this drag and amplify our long-term returns. Important: In an inflationary regime like we are in now, bonds do NOT protect on the downside. Therefore, the typical 60/40 stock-and-bond portfolio will not protect investors the same way they have for the past four decades. Holding bonds in today’s world is a recipe for mediocrity.
By being proactive in our trading, we’ve been able to avoid major drawdowns like in 2020 and 2022, reducing portfolio volatility. We enjoy all the upside of owning 100% stocks while limiting some of the risks. Of course, our approach isn’t without risks. There will be times when we get whipsawed and our trades don’t work out as planned. There will be times we sell the portfolio, only to re-enter at a higher price. It sucks, but that’s all part of the process!
Market update
This week we witnessed a 5% selloff in SPX. It first started with the soft inflation data two weeks ago, which triggered a momentum squeeze out of tech stocks and into small cap stocks. The selloff was then accelerated by problems at chip companies, weak earnings results from GOOG and TSLA, and the CrowdStrike fiasco.
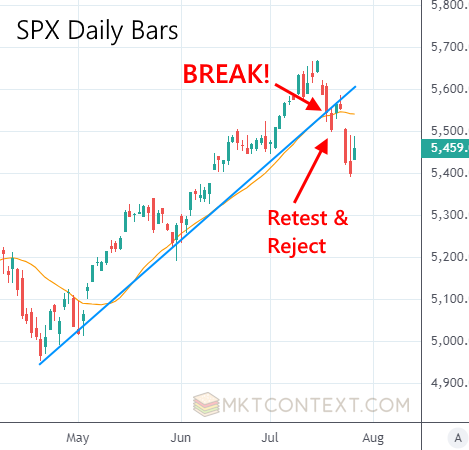
This is the crucial break we saw at the time: a break of the clean uptrend since the April lows. The break was further confirmed by a retest-and-reject (as we predicted) at which point we sold 30% of our portfolio to cash. Always trade in tranches to avoid whipsaw.
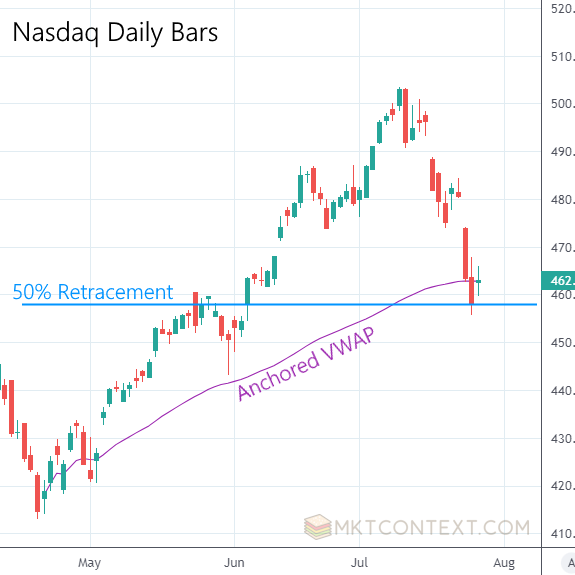
The market continued to sell off but showed signs of life by the end of the week. The SPX bounced at the 50d moving average, while the QQQ bounced at the 100d (this is a tech-led selloff so we need to watch Nasdaq as well). Furthermore, the QQQ rejection occurred at the -10% price level (psychological level), the 50% retracement level, and the anchored VWAP from April lows. Nasdaq-100 put/call ratios are also showing extreme negative sentiment. Sometimes, Nasdaq tells a better story than the S&P500!
Note: If you don’t know what any of these indicators are, no worries as we will explain them in future posts. Suffice it to say this is a logical pivot point and we await further clues on what’s to come next.
Positioning unwind is done
Understanding the reason for a drop can help determine how soon/quickly a rebound will take place. For example, a simple unwind of a crowded trade should be shorter-lived and shallower than a structural deterioration in earnings or the macroeconomy.
As mentioned earlier, there was the large-to-small-cap unwind that was already underway. But this week there were simultaneously two other cross-asset-class unwinds that added fuel to the fire.
The first is the carry trade in USDJPY. The carry trade worked by capturing the huge interest rate difference between the US Dollar and Japanese Yen. With the two rates set to converge again, traders were forced to unwind the trade, causing a sharp selloff in the USDJPY exchange rate. This has transmission mechanisms to equity markets, particularly Nasdaq.
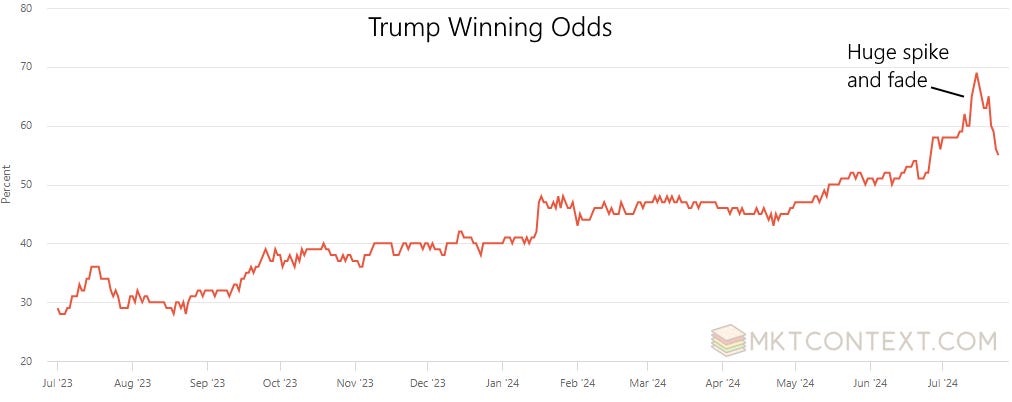
The second event was Biden announcing his exit from the presidential race. As Trump’s odds of winning soared to extreme levels, traders bought the SPX assuming his tax cuts and fiscal policies would be bullish - the same playbook from 2016. But Trump’s winning odds were already at unsustainable extremes (67% on betting sites). With the entrance of Kamala Harris, a more viable candidate than Biden, markets realized this would not be a landslide win for Trump and had to unwind that trade as well. This had a profound impact on large cap tech stocks.
In sum, three separate “squeezes” that forced traders to sharply sell SPX and QQQ. Understanding other traders’ positioning is like knowing your opponent’s hand in poker. The above shifts are short-term in nature and do not jeopardize the longer-term picture of strong earnings in a resilient economy. We want to be dip buyers when markets are panicking momentarily.
Predicting the next two weeks
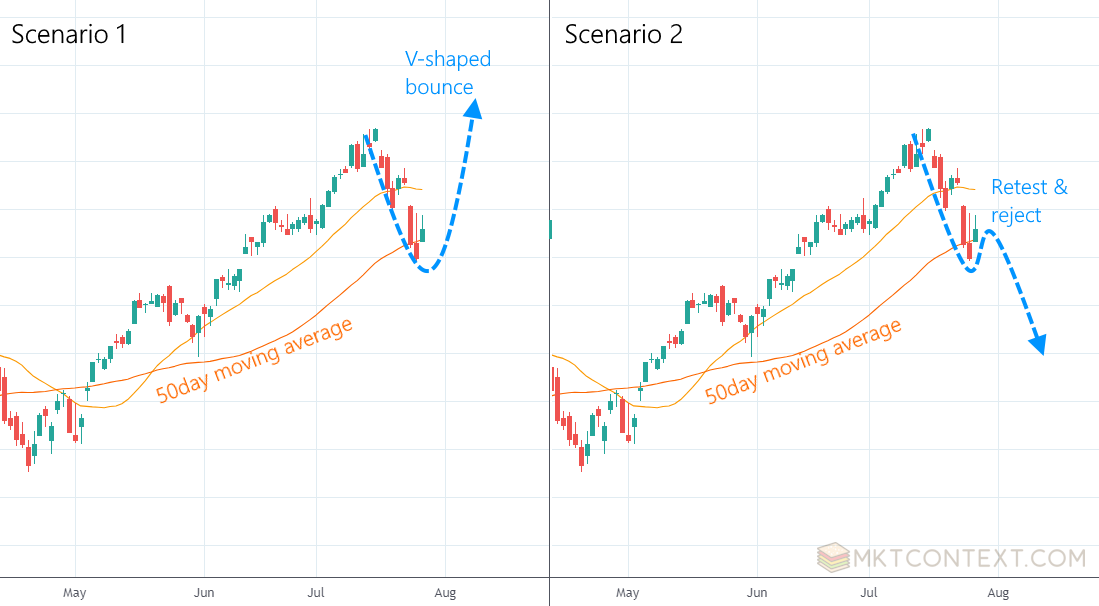
We are currently waiting for either a continuation to the downside, or V-shaped recovery to the highs. Key upcoming catalysts that could move the market in either direction include: earnings from mega cap tech companies, economic data for jobs and manufacturing, and FOMC meeting at the end of the month.
Looking at these catalysts, we think the market is likely to bounce from here for these reasons (we’ll elaborate later in this letter):
Corporate earnings are strong, not just for tech but for the broader index of companies.
The economy continues to be resilient with consumers spending and manufacturers recovering.
Inflation continues to fall which should allow the Fed to cut interest rates sooner rather than later.
Next, we use technical analysis to confirm our macroeconomic thesis. The bounce is confirmed if QQQ breaks its downtrend structure and put/call ratios normalize. The put/call ratio picks up timing signals from the options market, and is an indicator of “frenzy” in the market… we need it to calm down. Lastly, we would also prefer to see breadth thrusts on the upside, meaning the entire market is participating in the rally.
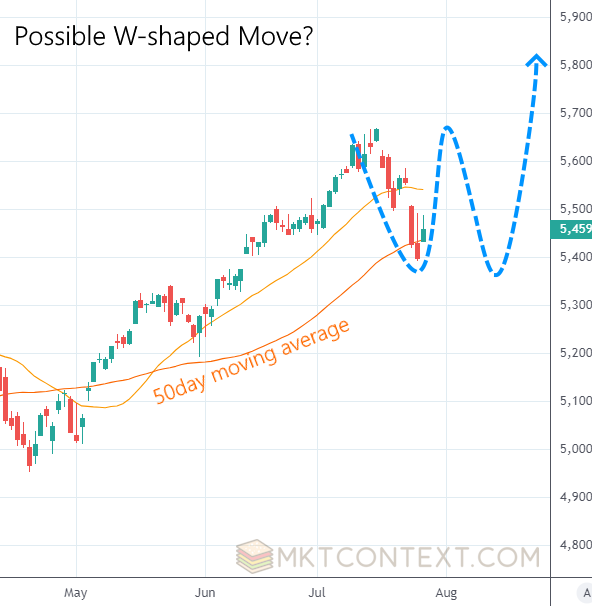
If a V-shaped rally occurs, readers will recall that we have a stop-buy on SPX at $5,650. That means if SPX rebounds to highs, we must re-enter into the market at 100%. This is necessary to prevent us from missing the upside if we’re wrong. What people don’t tell you about market timing is that you must time the entry AND the exit; one or the other won’t suffice. I have seen too many investors sell out just to get “locked out” of the next rally.
On the other hand, a definitive break of the 50d moving average in SPX (100d in the QQQ) would confirm further downside. This is not impossible as the put/call ratio for the broader market (not just Nasdaq) is not showing extreme pessimism as it usually does at the bottom of a selloff. We don’t expect this to happen given small caps are buttressing the market, but if it did, we would sell another 30% of our portfolio.
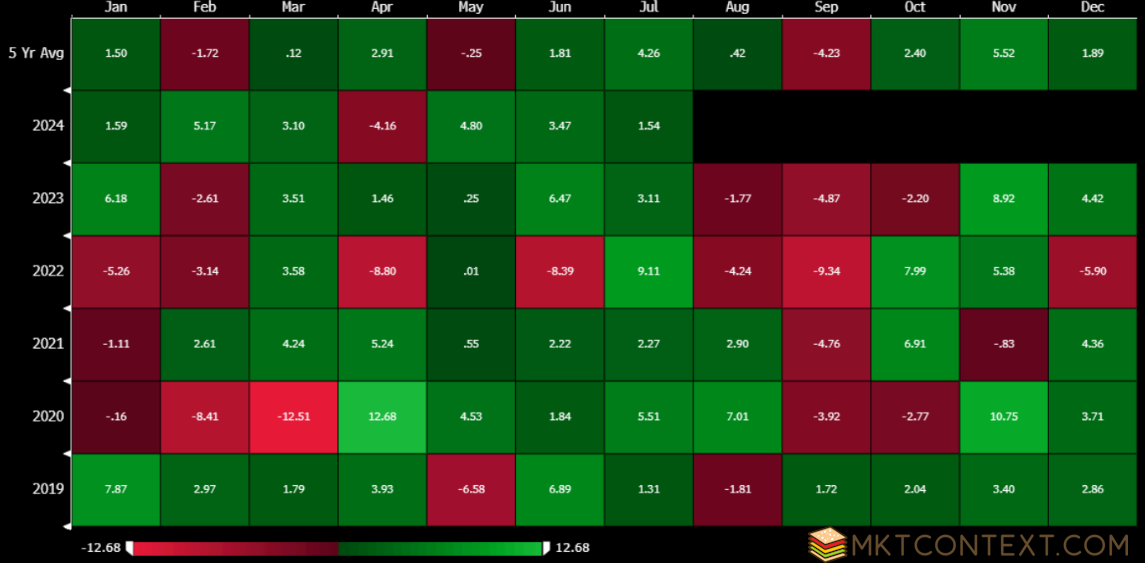
To further complicate things, August and September tend to be seasonally weak months. Also, we have an election coming up and markets tend to throw a tantrum roughly 2 months prior to voting day. This means we could see a W-shaped move like so:
If you’re wondering the reasoning behind Aug and Sept weakness, there are a few theories out there. But it’s generally understood that fund managers are away on vacation, leaving poor market liquidity, around the same time people liquidate stocks to pay for school tuition. Regardless of the reason, seasonality is just a rough guide and can’t be relied upon heavily. Though the last few years have respected the seasonal patterns:
The thesis for small caps
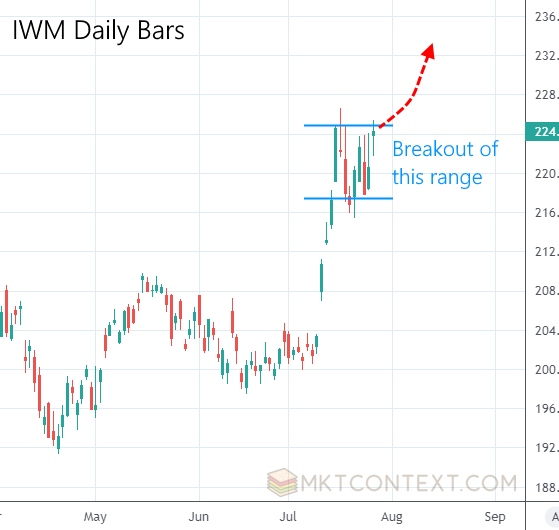
I’ve been hearing a lot of skepticism out there that small caps can continue their monstrous rally. It’s true, the IWM (Russell 2000 ETF) was rangebound the past two weeks. Naysayers suggest the US economy is heading for a recession, while inflation continues to run hot, both of which should be bad for small caps. This view is misguided.
By all accounts, the economy is NOT headed for a recession. Bears will cherry-pick data points like rising credit card delinquency, rising unemployment, and the inverted yield curve. But these things ignore the reality that this economic cycle has been very different from past ones because of Covid-era distortions. Economists’ models aren’t tuned to pick up on the nuance - we wrote a post about this before but let’s recap a few points:
Homeowners and corporates immunized themselves from rising interest rates and are actually benefiting from Fed tightening. People are spending money because they remain gainfully employed as wages are rising. Sure, there is some pain in lower-income consumers, but the middle and upper brackets are feeling wealthier from rising stock markets and are thus spending on vacations and experiences. To top it off, the Atlanta Fed just reported GDP grew nearly 3%. That simply doesn’t happen in recessions.
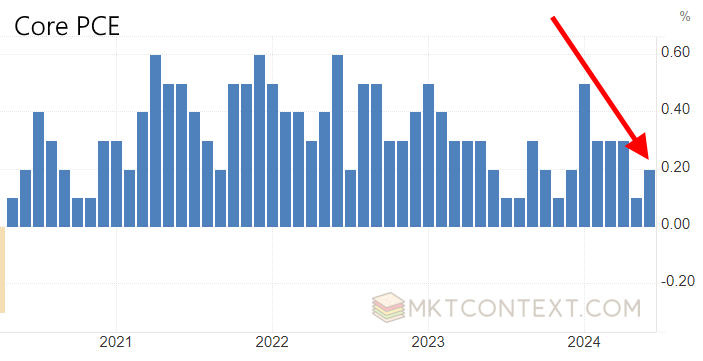
Meanwhile, inflation continues to fall, a fact that many refuse to believe. What’s caused inflation angst is stubborn car insurance and shelter prices, which are both notoriously laggy. But they are trending in the right direction. This week’s core PCE came in at 2.2% annualized; does anyone look at the below chart and think inflation is rising?!
With inflation down near the Fed’s magical 2% target, they have a reason to start cutting soon. Economic growth + falling inflation is a potent mix to fuel small cap stocks. More importantly, the market historically doesn’t price-in the full move until the cut has come and passed, meaning there is more room to rally.
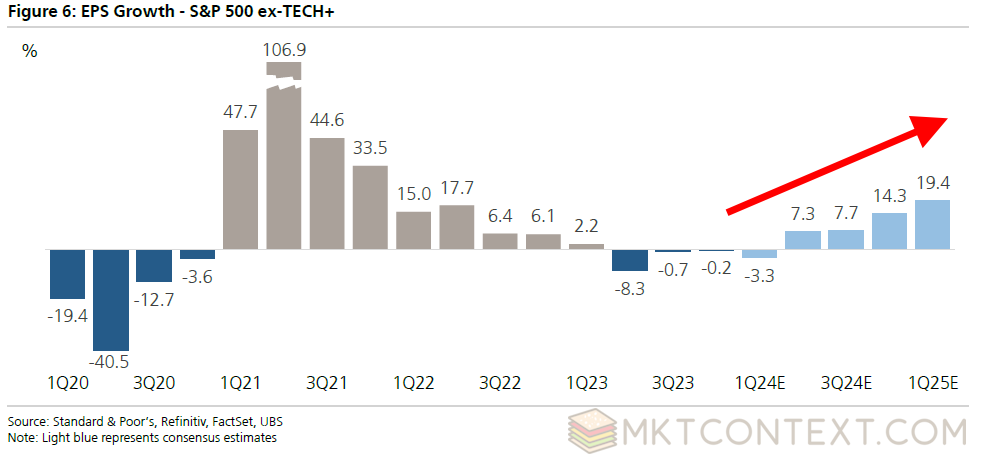
What about earnings? Earnings for the S&P 493 (i.e. S&P 500 ex. Mag 7) are coming out of a two-year slowdown and inflecting upwards. Estimates are being revised higher, and ALL sectors are participating in the improvement. This is key as it gives fundamental investors a reason to start allocating funds to small caps. In this segment of the market, it looks like we’re coming OUT of a recession, not heading INTO one.
Technical analysis of IWM
Technicals are not just about drawing lines on a chart (it is, but it’s also a lot more). It includes analyzing the components of the index and the positioning of other traders. Sort of like analyzing the deck and other players in poker. On that note, IWM has a great technical setup right now. A break of the two-week range would be a clear signal for a rally continuation:
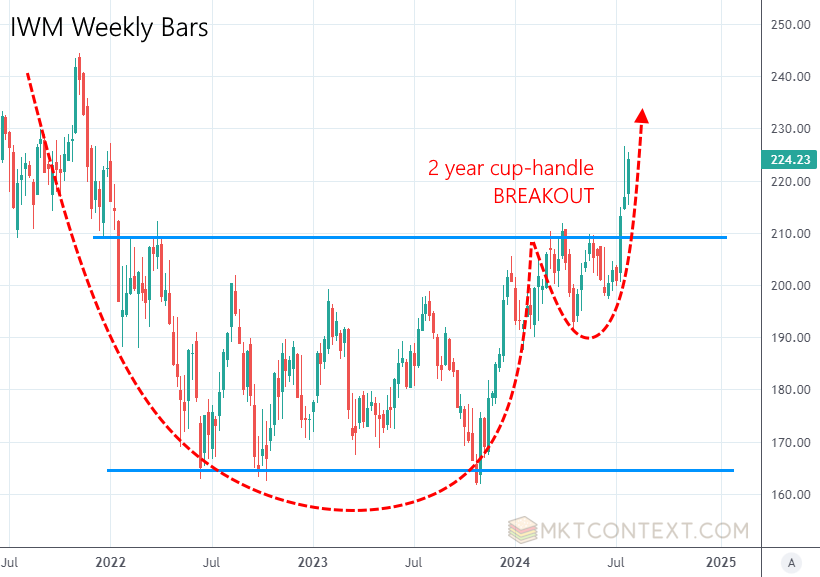
On the weekly chart we can see it is starting to break out of a two-year range and getting off the mat. These types of cup-and-handle breakout patterns signal a continuation rally is about to happen. Note that the rally in Nov 2023 saw the IWM rise 25% - an analog that we think can repeat again.
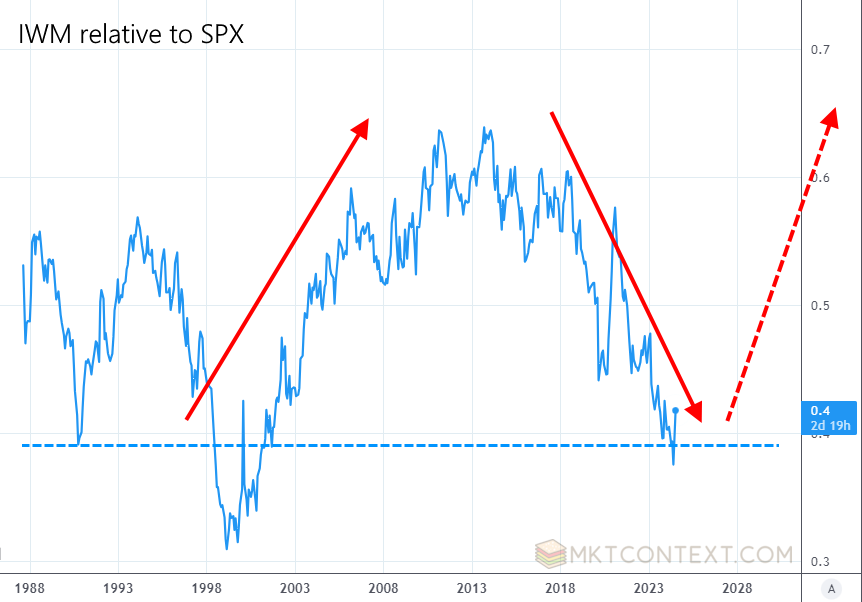
Longer term, we are about to see IWM reverse a decade-plus of underperformance relative to the SPX:
Last week we had a breadth thrust signal fire in the IWM. A breadth thrust occurs when the vast majority of stocks move up in tandem, and is a sign of changing market sentiment. It is a bit unusual to see it fire this late in the game, but nonetheless is a strong signal for outperformance over the next 12 months.
Our backtests show that when the IWM breaks out with the strength that it did (+10% in 10 days), forward returns over the next 12 months tend to be very good. This happens in about 75% of the instances that we studied. If we narrow it down further to instances outside of a recessionary period, the odds of success increase to 90%.
Positioning indicators (remember knowing the opponent’s poker hand?) in institutional funds and hedge funds are still relatively muted. They have obviously spiked since the beginning of the month due to the short squeeze, but they are not at extremes yet. As the IWM continues to run, more investors will need to unwind their positions, adding support to small caps.
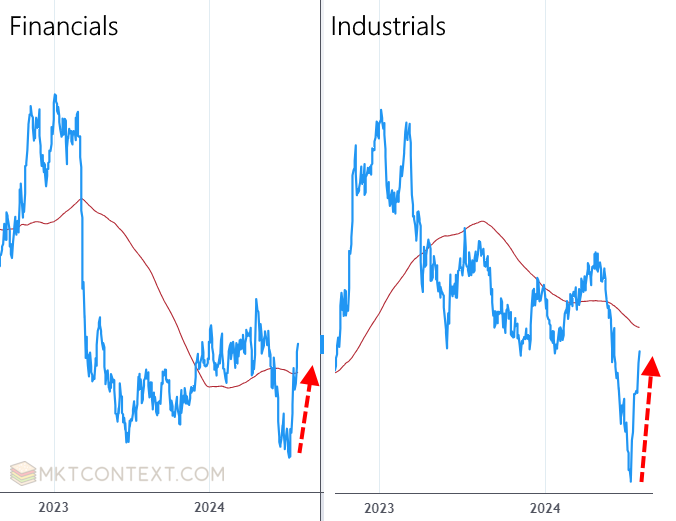
Looking under the hood at the sector composition, the Financial and Industrial sectors had been trading like we are headed for a recession. These are traditionally cyclical sectors that react poorly to volatile economic data. But with Fed cuts in view and economic data inflecting, these two sectors have also recovered to their 200d moving average. This is a strong signal that the cyclical rally is underway!
5 stock picks
Our picks this week follow the above themes of small caps and cyclical leadership.
TBBK 0.00%↑ - $52 price, $3B market cap. The Bancorp is not your typical bank. Instead of focusing on traditional consumer and commercial banking, their business model is centered around providing payment processing services to other businesses. They are the behind-the-scenes provider of prepaid cards, virtual cards, and other payment tech for fintechs like PayPal. This provides them with low-cost capital that they can lend to specialty finance companies - wealth managers, small businesses, commercial fleet lending, real estate bridge loans, and the like. The result is a high margin, high return-on-equity banking business that is growing its earnings rapidly. The stock price is breaking out to new highs and should benefit from easing financial conditions and improving economic activity. It trades at 11x forward P/E.
WTFC 0.00%↑ - $110 price, $7B market cap. Wintrust is the dominant community bank in the Chicago area with 150 branches. They have been acquiring other banks to grow, and now own 15 brands under its umbrella. These banks provide a full suite of retail and commercial banking services, including checking/savings accounts, business loans, mortgages, and wealth management. They also provide specialty finance such as equipment leasing and insurance loans. The community banking model allows Wintrust to develop deep relationships and tailor its offerings to the specific needs of each local market. Loans are rock solid and are growing faster than peers. With interest rates falling, they stand to benefit from improving lending activity, improving margins, AND more M&A activity to keep growing. It trades at 11x forward P/E.
MLI 0.00%↑ - $70 price, $8B market cap. Mueller is an industrial manufacturing company. They make tubes and coils that go into plumbing, HVAC, and refrigeration. They supply residential, commercial, and industrial construction markets. What sets them apart from peers is their vertically-integrated supply chain: they do everything from raw material processing to finished product fabrication and distribution. That allows them to capture value at every stage while keeping costs low. It gives them a comprehensive suite of solutions to customers and allows them to be nimble in responding to shifting demand patterns. Over the past 12-18 months, Mueller has benefited tremendously from robust construction demand including new home building, home remodeling activity, and commercial projects. As interest rates become less restrictive and reshoring continues to be a major theme, Mueller should see its end market activity accelerate from here. Trades at a 14x P/E.
BLBD 0.00%↑ - $52 price, $2B market cap. Blue Bird makes school buses and has been the dominant player for decades. Before you roll your eyes at this company, they are undergoing a major growth spurt from the transition to alternative-fuel buses. The recently passed US infrastructure spending bill provides funding for school districts to acquire alternative-fuel buses such as electric, propane, or compressed natural gas. This shift is being accelerated by evolving environmental regulations, such as school districts’ desire to reduce their carbon footprint and operating costs. Coincidentally, many school districts across the U.S. have aging bus fleets and are in need of a renewal/modernization. This combined impetus for spending is set to “drive” bus orders for the next ten years. Blue Bird benefits from deep expertise of the varying regulatory requirements in its areas, lean manufacturing techniques, and has been gaining market share by strategically acquiring smaller competitors. Trades at a 17x forward P/E.
MNKD 0.00%↑ - $5.85 price, $2B market cap. I don’t usually do biotech stocks, but this is a different animal, and declining interest rates are a major boon for biotechs who rely on external financing to fund R&D efforts. Mannkind is a specialty pharmaceutical company focused on inhalable therapies, primarily for the treatment of diabetes. Mannkind’s lead product is Afrezza, an inhaled insulin therapy for type 1 and 2 diabetes. Before you say “Ozempic”, inhaled insulin works differently from GLP-1s. While GLP-1s work to slow digestion and reduce appetite, insulin directly lowers blood glucose and is needed in certain diabetics. Inhalables are also fast-acting, so they can be used to control post-meal blood sugar spikes. Most importantly, GLP-1s may work for type 2 diabetes but not necessarily for type 1. The fact of the matter is GLP-1s don’t work for everyone (nor can be afforded by everyone), and some patients still need insulin therapy. The world will need dual track development of both GLP-1s and new insulin tech to continue fighting the battle against diabetes. If anything, the success of GLP-1s have brought diabetes treatment into the public spotlight, improving public understanding and widening the demand for Mannkind’s products. I should remind investors that this is a risky stock with binary outcomes that could result in large drawdowns in the stock!
That’s all for this week!
Thanks for reading! We hope you enjoyed this deep dive on market timing and small caps. Subscribe to us at MktContext.com to receive regular updates on stocks and trading!


