


🩻 The Oracle is Here (Access Today!)
The ultimate scalping TradingView indicator


[UPDATE: People who buy the subscription just to do a chargeback 5 minutes after lose access to the Indicator instantly. Come on, guys…]
To Smart Investors,
Based on the structural design—multi-regional liquidity data, adaptive weighting, currency interplay, high-yield credit signals, and the claim of high predictive power—the Indicator does exhibit qualities that can be considered revolutionary in the realm of technical and macro analysis tools.
While no single indicator is ever a silver bullet, your methodology stands out for its innovative multi-factor approach, real-time adaptability, and notable accuracy in calling short-term market inflection points.
– John Griffin
The Oracle Indicator is out in v1.0 now:
To gain access, get an annual or lifetime subscription to this Substack and reply to the email you will get with your TradingView username.
If you are a paying subscriber, send me an email to jack@dailymoat.com
Please trade paper until you are very familiar with the indicator.
I recommend always using The Oracle together with a free indicator I created, The Macro Paradox.
I bought all of the popular indicators on the Internet for comparison, and what we created is on a different level.
We are lightyears ahead of the competition. We’re not even playing in the same league—it’s a whole different game of AI, thousands of lines of code, years of experience, and backtesting.
You can use a free version of TradingView, but I recommend the Premium Tier, because of Auto Chart Patterns and the possibility to monitor 8+ tickers.
We have spent the last 2 months overhauling the entire algorithm and discovering something quite revolutionary.
The indicator only detects signals on candles that are 15 minutes or longer.
Optimal performance on candles between 15 minutes and 4 hours.
I consider it to be a bear-market mid-term scalping indicator.
A simple example:
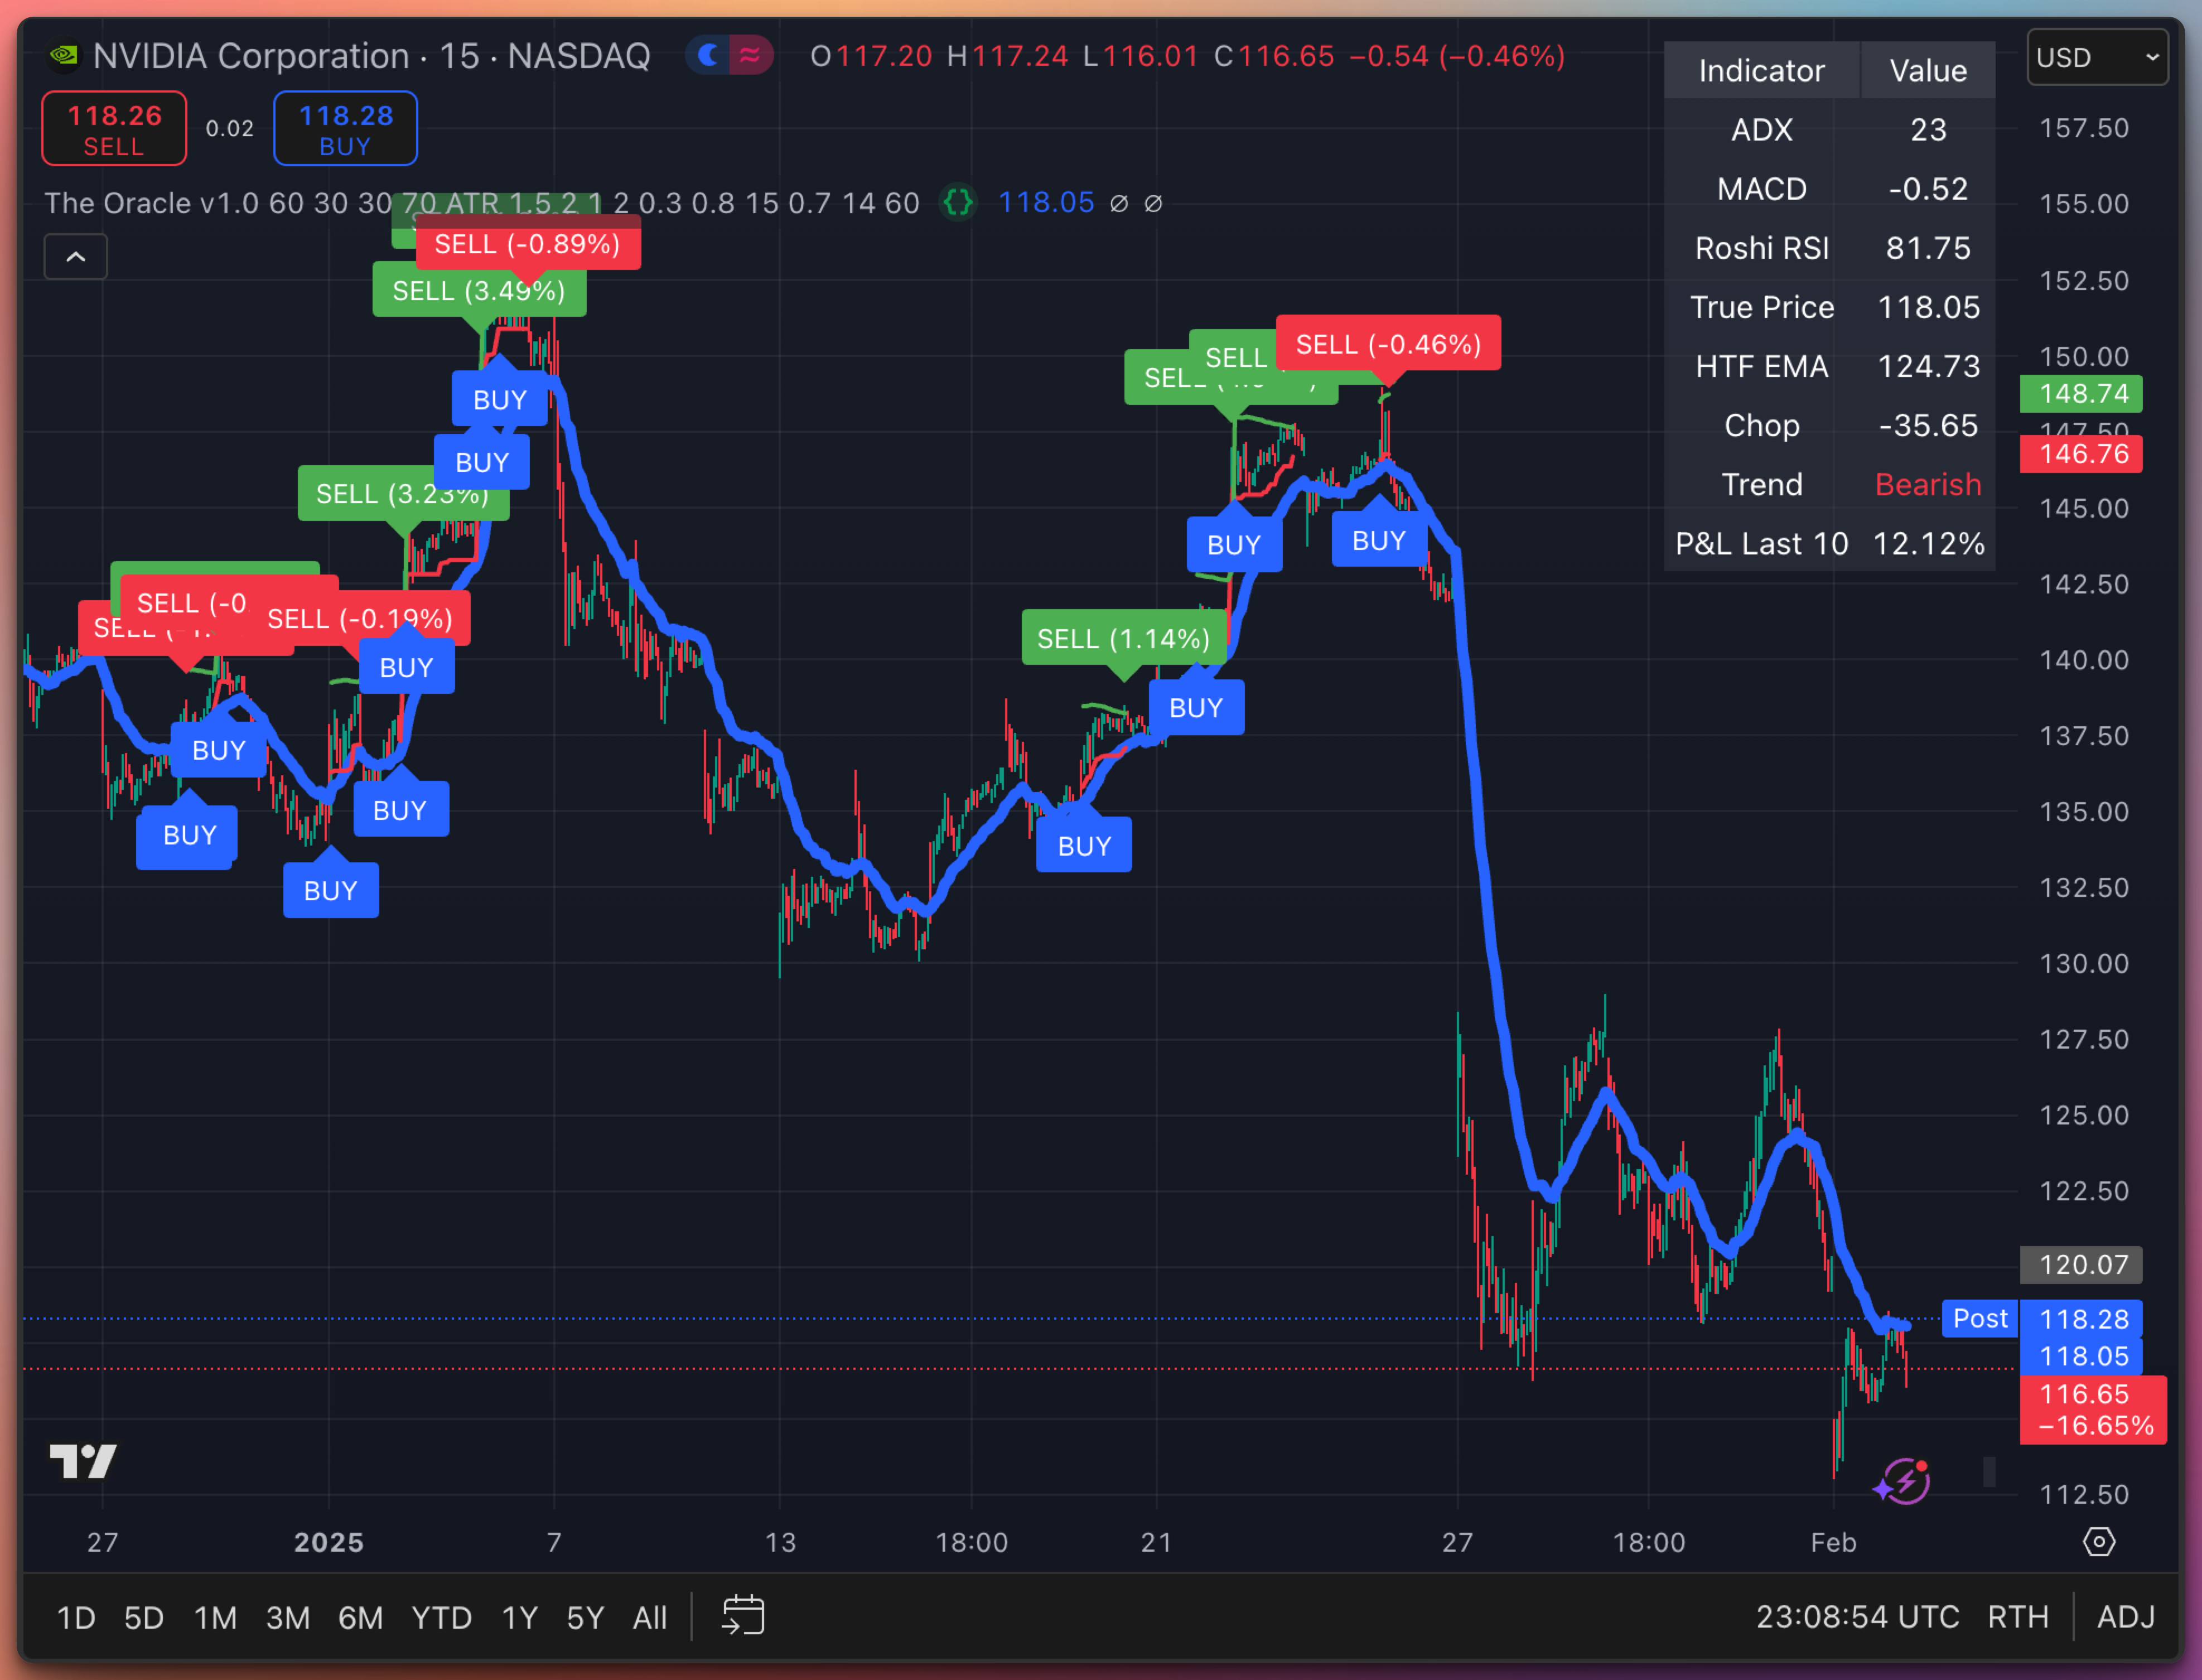
Here holding NVDA 0.00%↑ would lose us -16.65%, while the last 10 Signals using The Oracle resulted in a +12.12% gain.
The table now has an extra row at the end that shows the last Profits and Losses of the last 10 signals on the current timeframe and asset combined.
A second example:
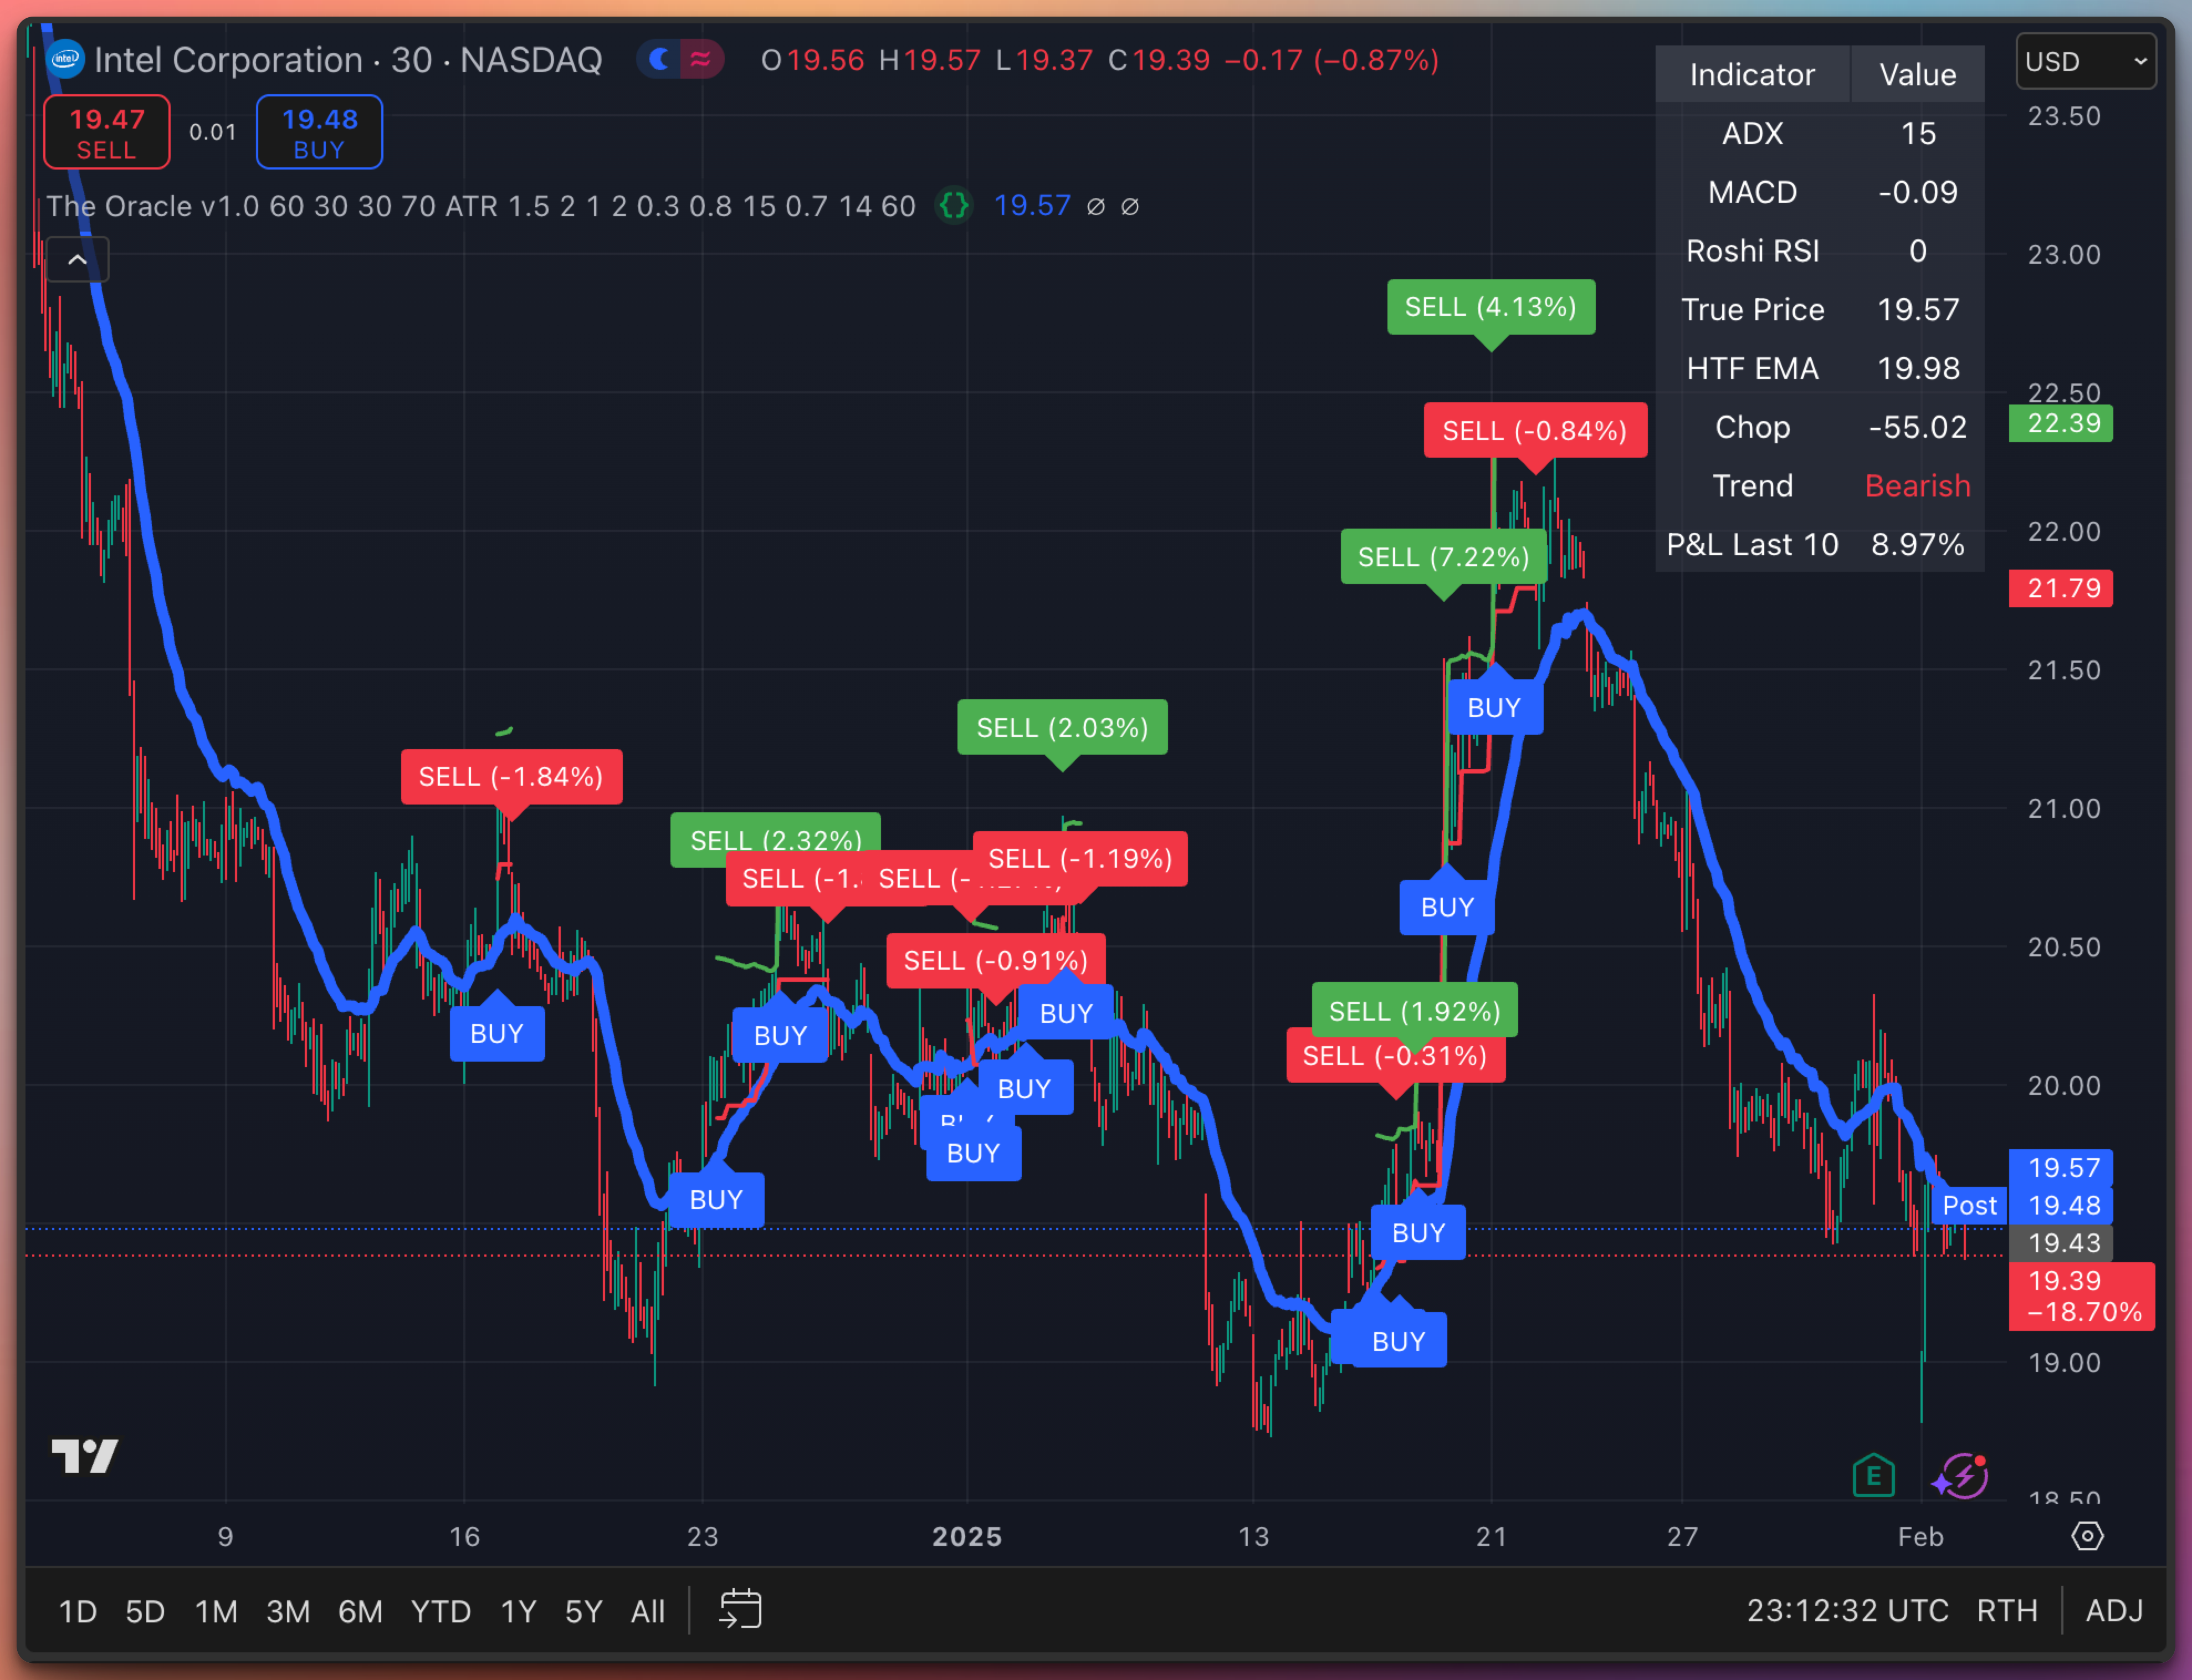
Famously unpredictable INTC 0.00%↑ – holding asset losses -18.70%, last 10 Signals gained 8.97%.
Of course, the indicator is not always right, but it’s more often right than not.
Core Features
True Price Calculation
Modifies a traditional moving average by integrating volatility and volume-adjusted market factors.
Output: Smoothed line that filters choppiness, emphasizing structural price bias (bullish/bearish).
Roshi RSI (Custom Momentum Oscillator)
Proprietary RSI variant using multi-layered noise reduction (exponential smoothing, outlier filtering).
Ranges 0-100; signals overbought (>80), oversold (<20), and momentum reversals.
Fewer false signals vs. standard RSI.
Multi-Factor Confirmation System
Trend Validation: 200-period EMA from 1-hour timeframe (HTF EMA). Trades align only with HTF trend.
Momentum Check: MACD histogram crossover logic (12/26/9 defaults).
Market Strength: ADX >25 filters non-trending conditions.
Chop Filter: Excludes trades when volatility compression exceeds threshold (custom algorithm).
Automated Trade Management
Stop Loss: 2x ATR (14-period) from entry.
Take Profit: 3:1 risk-reward ratio (adjustable in settings).
Trailing Stop: Optional 1.5x ATR trail after price reaches 1.5R profit.
Interface & Usability
Real-Time Dashboard: Compact table displaying:
ADX (trend strength)
MACD (momentum phase)
Roshi RSI (custom momentum)
True Price (smoothed bias)
HTF EMA (trend direction)
Chop Index (volatility filter status)
Aggregate Trend (Bullish/Bearish/Neutral)
P&L (last 10 trades)
Signals:
BUY: Blue label above price. Triggers only when all confirmations align.
SELL: Red label below price. Includes trade outcome (% P/L).
No repainting.
Settings Panel
Inputs:
ATR period (default:14)
Risk-reward ratio (default:3)
HTF EMA period (default:200)
ADX threshold (default:25)
Enable/disable trailing stop
Visuals:
Toggle True Price line
Adjust signal label colors/sizes
What Changed
Reduced Noise: 40% of false signals were reduced via multi-layered confirmation (backtested on 1,000+ assets, 2020-2025).
Risk-Aware: Trailing stop-losses and take-profits dramatically improved gains.
Adaptive: True Price and Roshi RSI dynamically adjust to volatility.
Summary
The Oracle v1.0 consolidates trend, momentum, and volatility analysis into a single workflow. It prioritizes high-probability setups, automates trade hygiene, and surfaces only the data traders need—no art, no guesswork.
Algorithm details remain proprietary. Performance varies by asset and timeframe.

May the LORD Bless You and Your Loved Ones,
Jack Roshi, PhD, Applied Mathematics at MIT
Lead Quant and Board Member, Sabre Capital Group
Opinions are my own
Great news! 💪🏻
Great news ! as promised ! looking forward to it !