


🩻 Week 50, 2024: Nasdaq Hits 20,000—Then Gets Shaken: What the Fed’s Secret Signals Mean for Your Money
Brace Yourself—Inflation’s Getting Ugly and the Next Rate Cut Could Change Everything


To Smart Investors,
We’re back with fresh, unbiased data for this week's US stock market.

Super Important Stuff!
Last week, we spent over 200 man-hours improving the Indicator and Telegram Signals.
At this point, my Signals are consistently outperforming SPY in a bear market.
We also received a lot of feedback from hundreds of you, which was extra helpful. If everything goes according to plan this week, we will release a Beta version of the True Price Indicator. This version will also work great on shorter time frames and be more user-friendly and intuitive.
Your input and feedback for the Alpha version of the Indicator were priceless, and they really helped us speed up its development. You guys discovered several edge-case bugs that wouldn’t have been easy to catch on our own.I didn’t finish it before the weekend, but this week, I will 100% publish a guide on how I use PERSONALLY the Signals and the Indicator to trade this week. It seemed simple to write when I started, but then I realized there is a lot of explaining to do, especially for beginner traders.
The SaaS coming in early 2025 will be available to all past and current paying subscribers and revolve around scanning what the big guys are doing (mostly institutional options flow and shady stuff like dark pools). I have already implemented the logic for the Telegram Signals, but I want you to have this information at a glance at any time to make your own decisions about what is a good signal.

The free weekly Podcast is here:


Stuff I Published Last Week:


As Always In The Sunday Report:
I have written a deep dive into last week’s market recap, my predictions for the next week, and an ELI5 (Explain Me Like I’m 5).
You can also find my typical quant data and the stock insiders’ significant buys/sells with my interpretation.
Every day, I post summaries of news relevant to Investors. I try to post about 30 minutes before the markets open and cover the last 24 hours of news. On the weekends, I post in the afternoon.

Get my other daily newsletter for just $1/month or $10/year using the secret code here.


S&P500 Heatmap over the last week
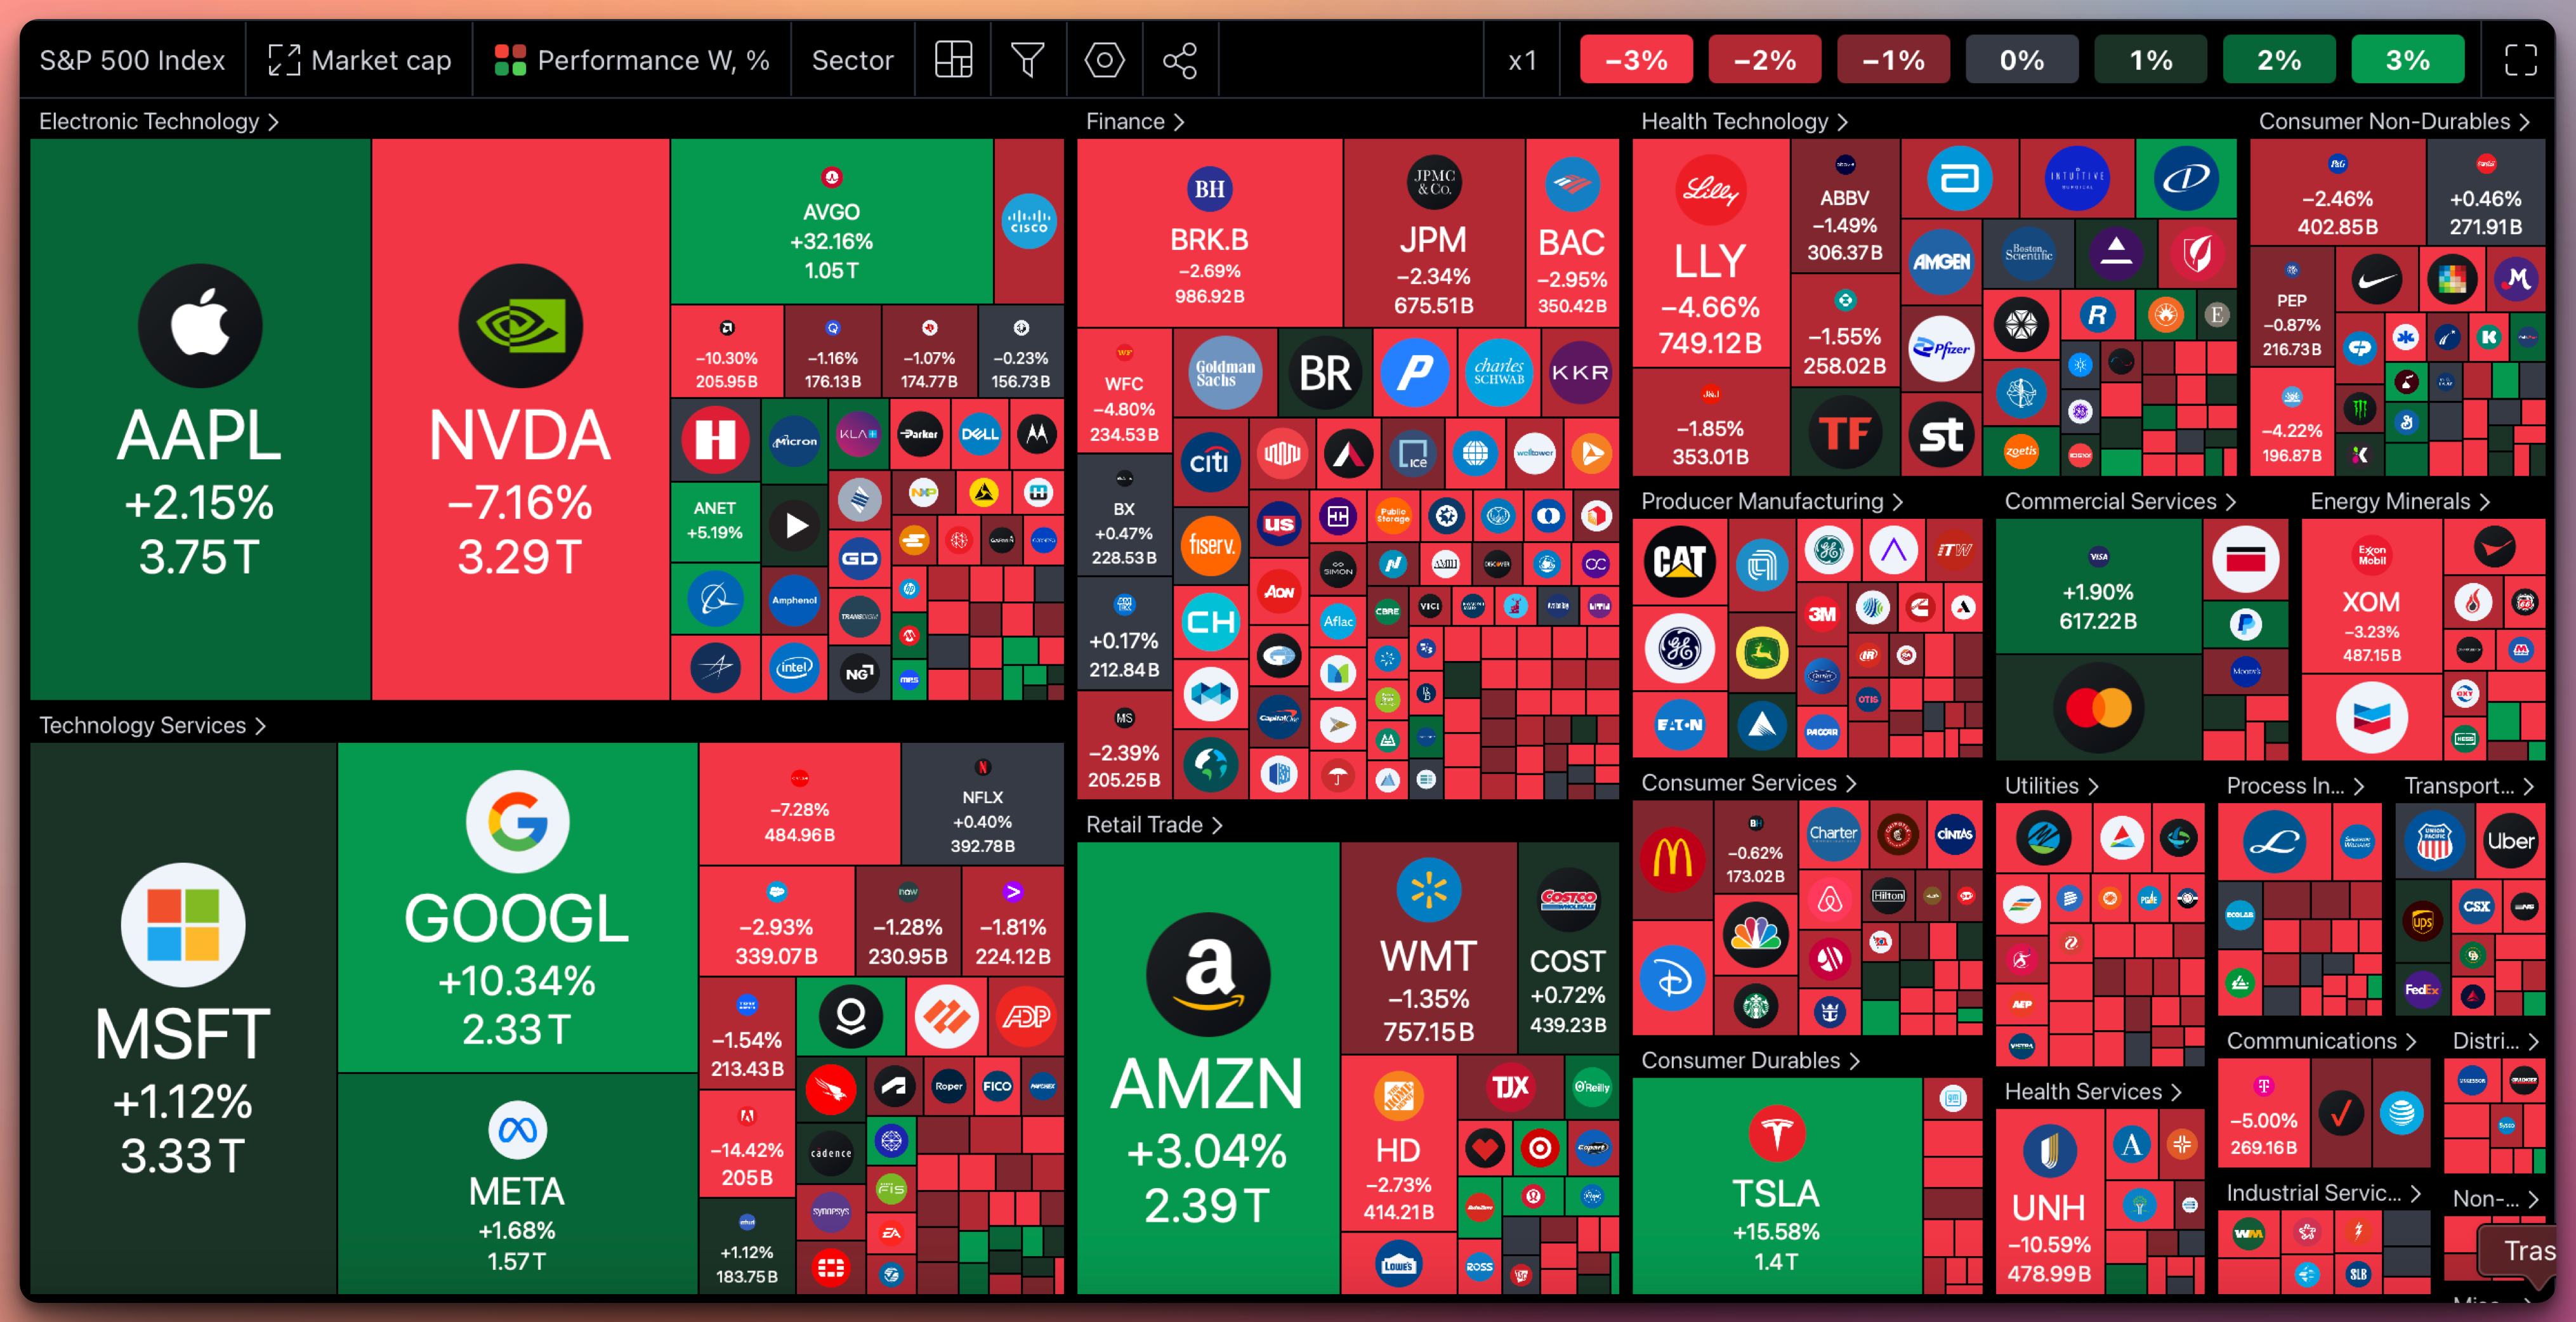
This graph was generated by our friends at TradingView. Did you know you can get 60% off the Premium plan forever, even though it's not Black Friday?
Excel data:

This graph was generated by our friends at TradingView. Did you know you can get 60% off the Premium plan forever, even though it's not Black Friday?
*Also, by the way, the chart above shows precisely why you need the Premium TradingView plan in your life. Look into this:
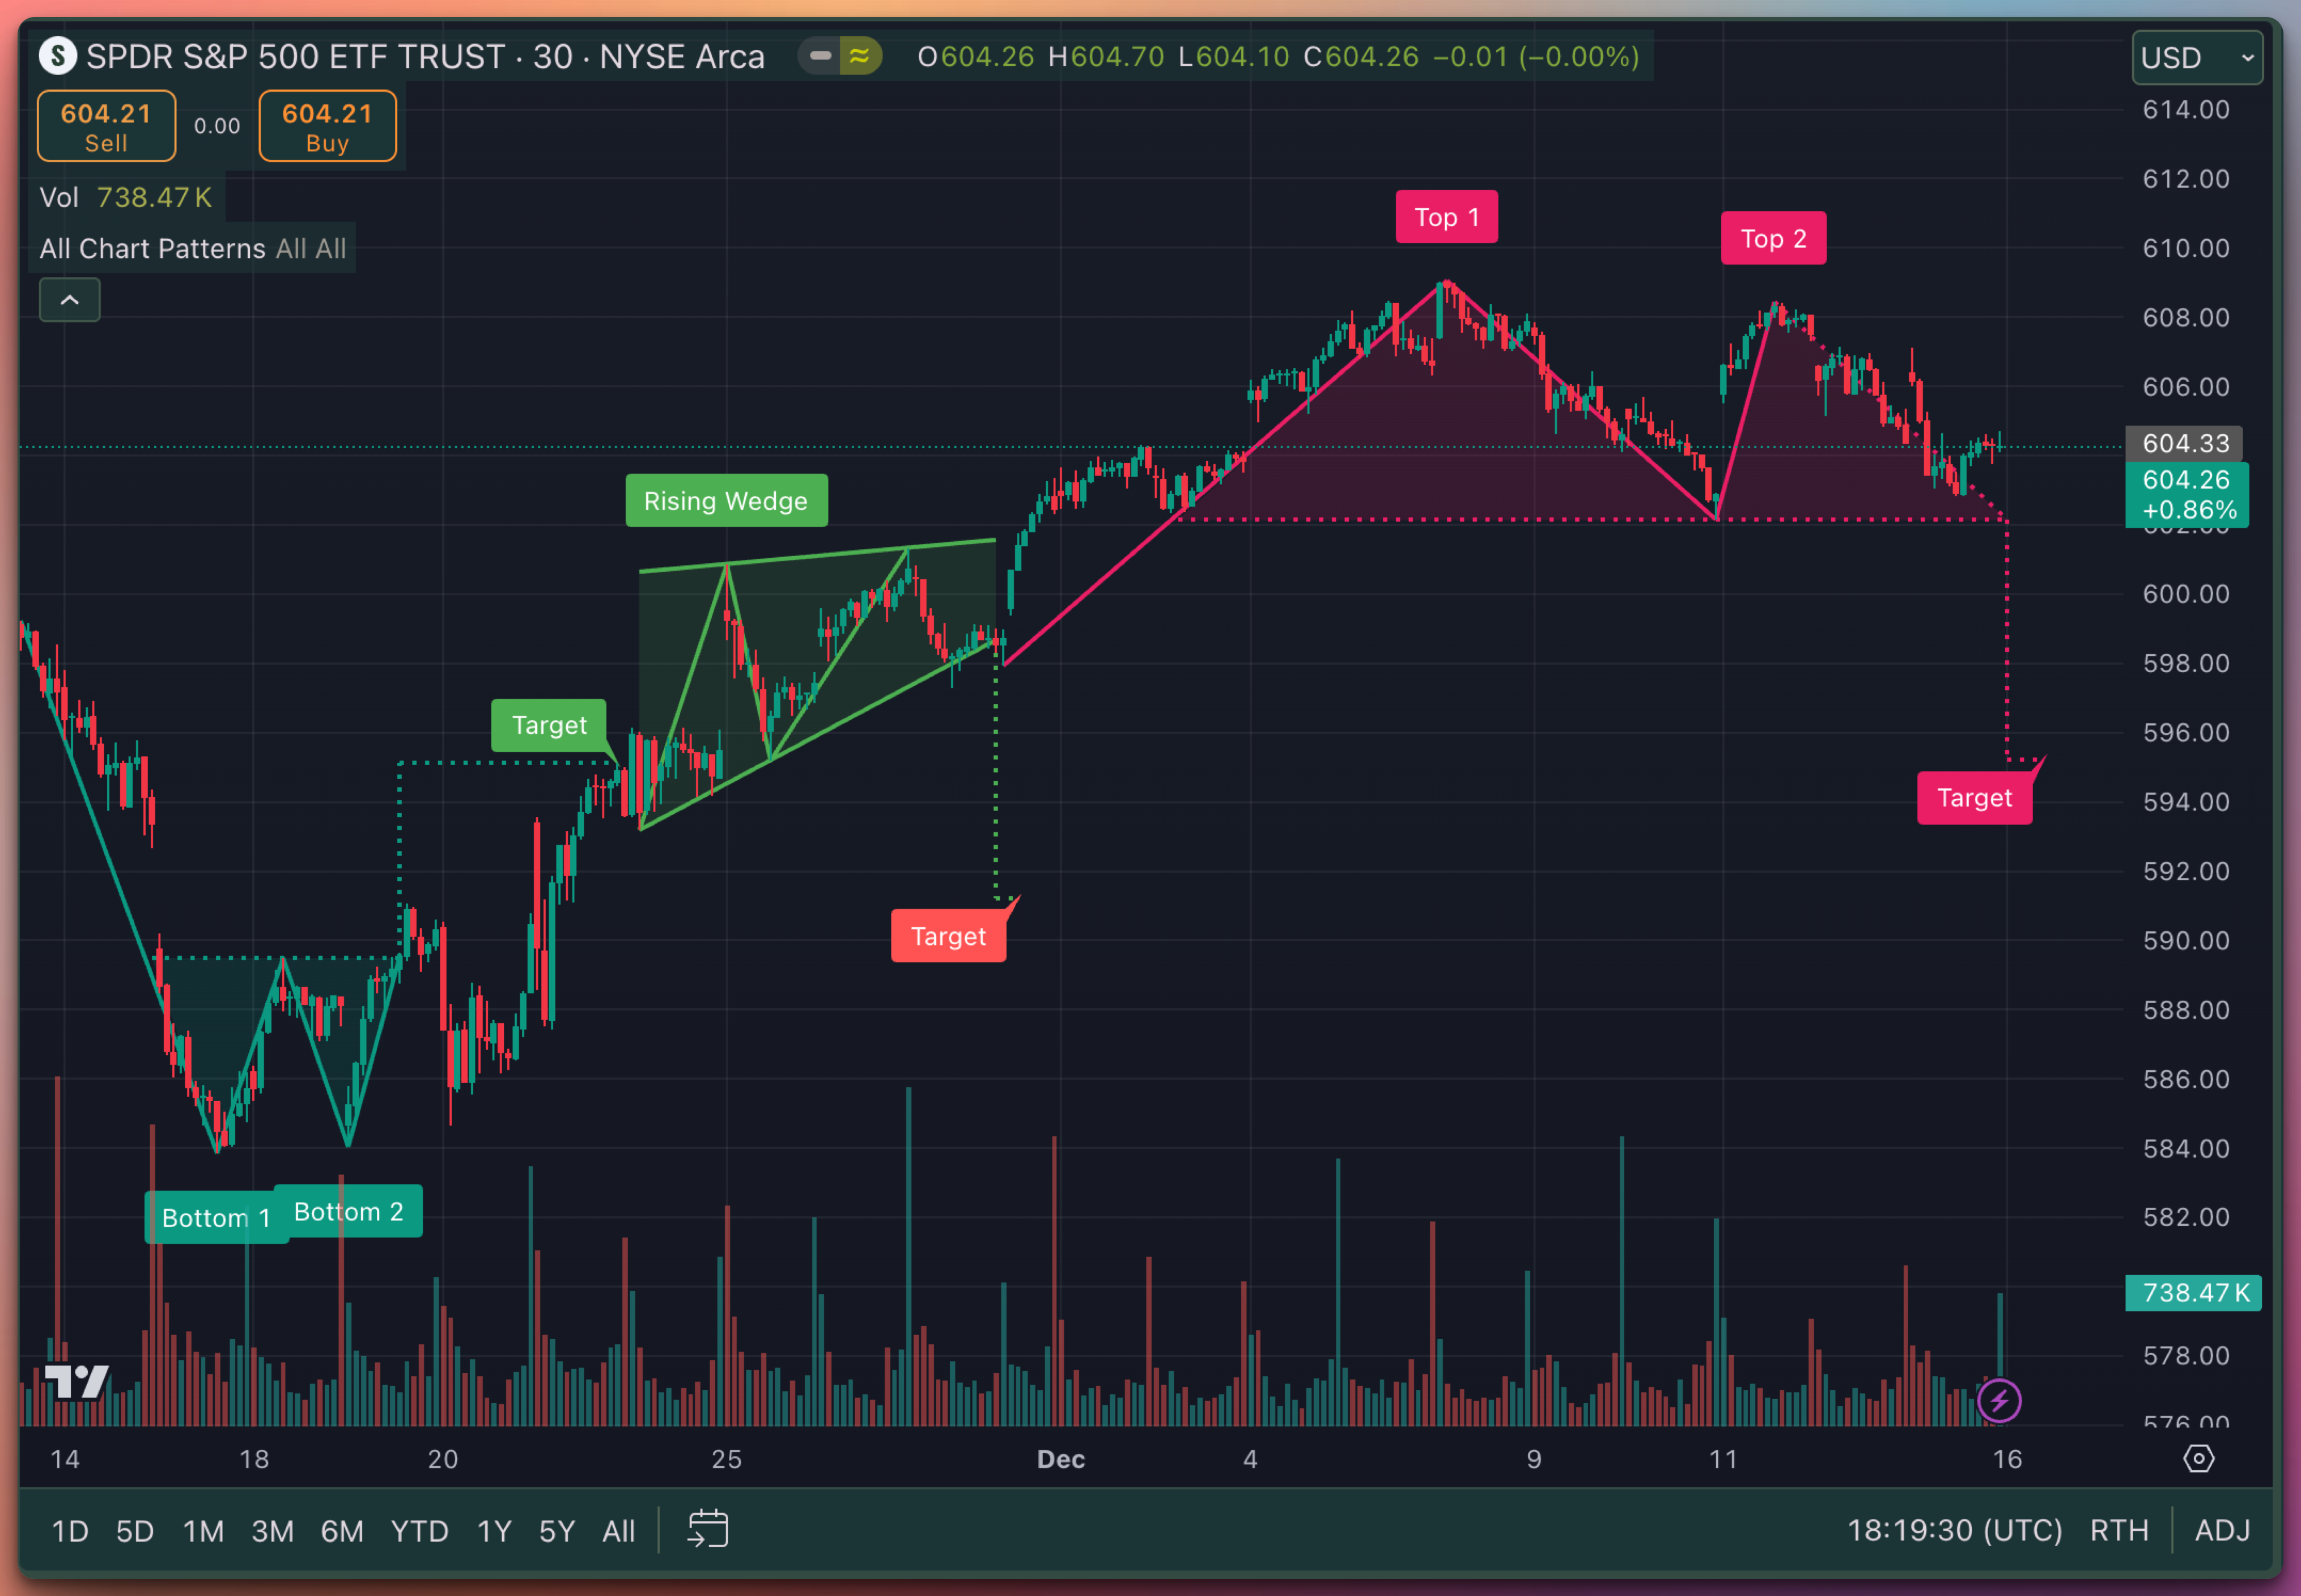
📊 SPY Technical Analysis & Projections
Recent Price Action
Rising Wedge Breakdown: Over the past month, SPY carved out a textbook rising wedge formation. Prices climbed steadily yet converged into narrowing highs and lows, culminating in a pronounced downside break. This breakdown under wedge support aligned with a visible increase in sell-side volume.
Double Top Formation: Post-wedge, SPY formed two pronounced tops—“Top 1” and “Top 2”—near a short-term resistance zone. These consecutive peaks have reinforced a double top pattern, suggesting waning bullish momentum and setting a more bearish near-term bias.
Technical Targets
Initial Downside Target: Following the wedge breakdown, the immediate measured move points toward the previously outlined target area near $594–$595, reflecting a methodical projection from recent price structures.
Secondary Support Levels: Should the $594 region fail to hold, the next structural supports, derived from volume profile and prior consolidation zones, line up in the $590–$592 range.
Outlook
Bearish Bias: The interplay of a wedge breakdown and a double top strongly hints at continued downward pressure. Unless SPY can reclaim key pivot levels—particularly those aligned with the double top neckline—technical signals favor a retest of lower support zones.
What to Watch: Monitor volume spikes on tests of $594–$595 support. A weak bounce or further pattern confirmation here would set the stage for probing deeper support levels and potentially intensifying the short-term downtrend.

Please send feedback and ideas using comments, PMs, or email. I answer all emails and PMs personally. There is no personal assistant BS here.
And, as always — stay informed — and do your own due diligence,
Jack the Signals Doctor, MIT PhD
Weekly Market Summary: December 9– December 13, 2024
Executive Summary
U.S. equities encountered stiff resistance this week, breaking a recent pattern of steady gains and revealing new cracksin the market’s underlying momentum. The Nasdaq Composite briefly surpassed the historic 20,000 mark, fueled by top-tier megacap tech names, before higher yields and mixed inflation signals eroded investor confidence. The S&P 500ended the week slightly lower, snapping its three-week winning streak, while the Dow Jones Industrial Average and Russell 2000 underperformed due to valuation concerns and profit-taking.
Stubborn inflation pressures—signaled by the November Consumer Price Index (CPI) and a Producer Price Index (PPI) print that exceeded prior readings—compelled Treasury yields to rise sharply. Core inflation remained above the Fed’s 2% target, intensifying scrutiny over the central bank’s next steps. Although the market expects a 25-basis-point rate cut at the upcoming FOMC meeting, lingering uncertainty around the persistence of price pressures and the nascent softness in the labor market constrained optimism.
Internationally, the European Central Bank (ECB) and Swiss National Bank (SNB) each cut rates, underscoring the fragile state of global growth. In Asia, the Bank of Japan faces mounting expectations for a rate hike in early 2025, while China’s policies failed to excite investors as deflationary trends persisted.
Overall, this week’s action underscores a more fragile equilibrium: monetary support seems imminent, but the path to stable inflation and sustainable growth remains unclear. As we head deeper into December, markets must digest the delicate interplay of policy moves, inflation indicators, and corporate earnings revisions—all against a backdrop of stretched valuations and profit-taking impulses.
Detailed Analysis
Keep reading with a 7-day free trial
Subscribe to The Stock Insider to keep reading this post and get 7 days of free access to the full post archives.