


🩻 Week 6, 2025: Is Your Portfolio at Risk?
Why gold is soaring past $2,900 and what falling yields mean for your portfolio.


To Smart Investors,
We’re back with fresh, unbiased data for this week's US stock market.

Super Important Stuff!
The final version of the Oracle Indicator (v. 1.0) has been released this week. Working on a very comprehensive guide on how to trade, which will be a hub located here.
Working on upgrading the Macro Paradox Indicator.
The new SaaS is coming out in about 2 weeks (long-term plays).

The free weekly Podcast is here:


Stuff I Published Last Week:


As Always In The Sunday Report:
I have written a detailed recap of last week’s market, my predictions for next week, and an ELI5 (Explain Me Like I’m 5).
You can also find my typical quant data and the stock insiders’ significant buys/sells with my interpretation.
Every day, I post summaries of news relevant to Investors. I try to post about 30 minutes before the markets open and cover the last 24 hours of news. On the weekends, I post in the afternoon.

Use the secret code to get my daily news newsletter for just $1/month or $10/year.


I’m slowly working on a new exciting newsletter. [FREE!]


S&P500 Heatmap over the last week
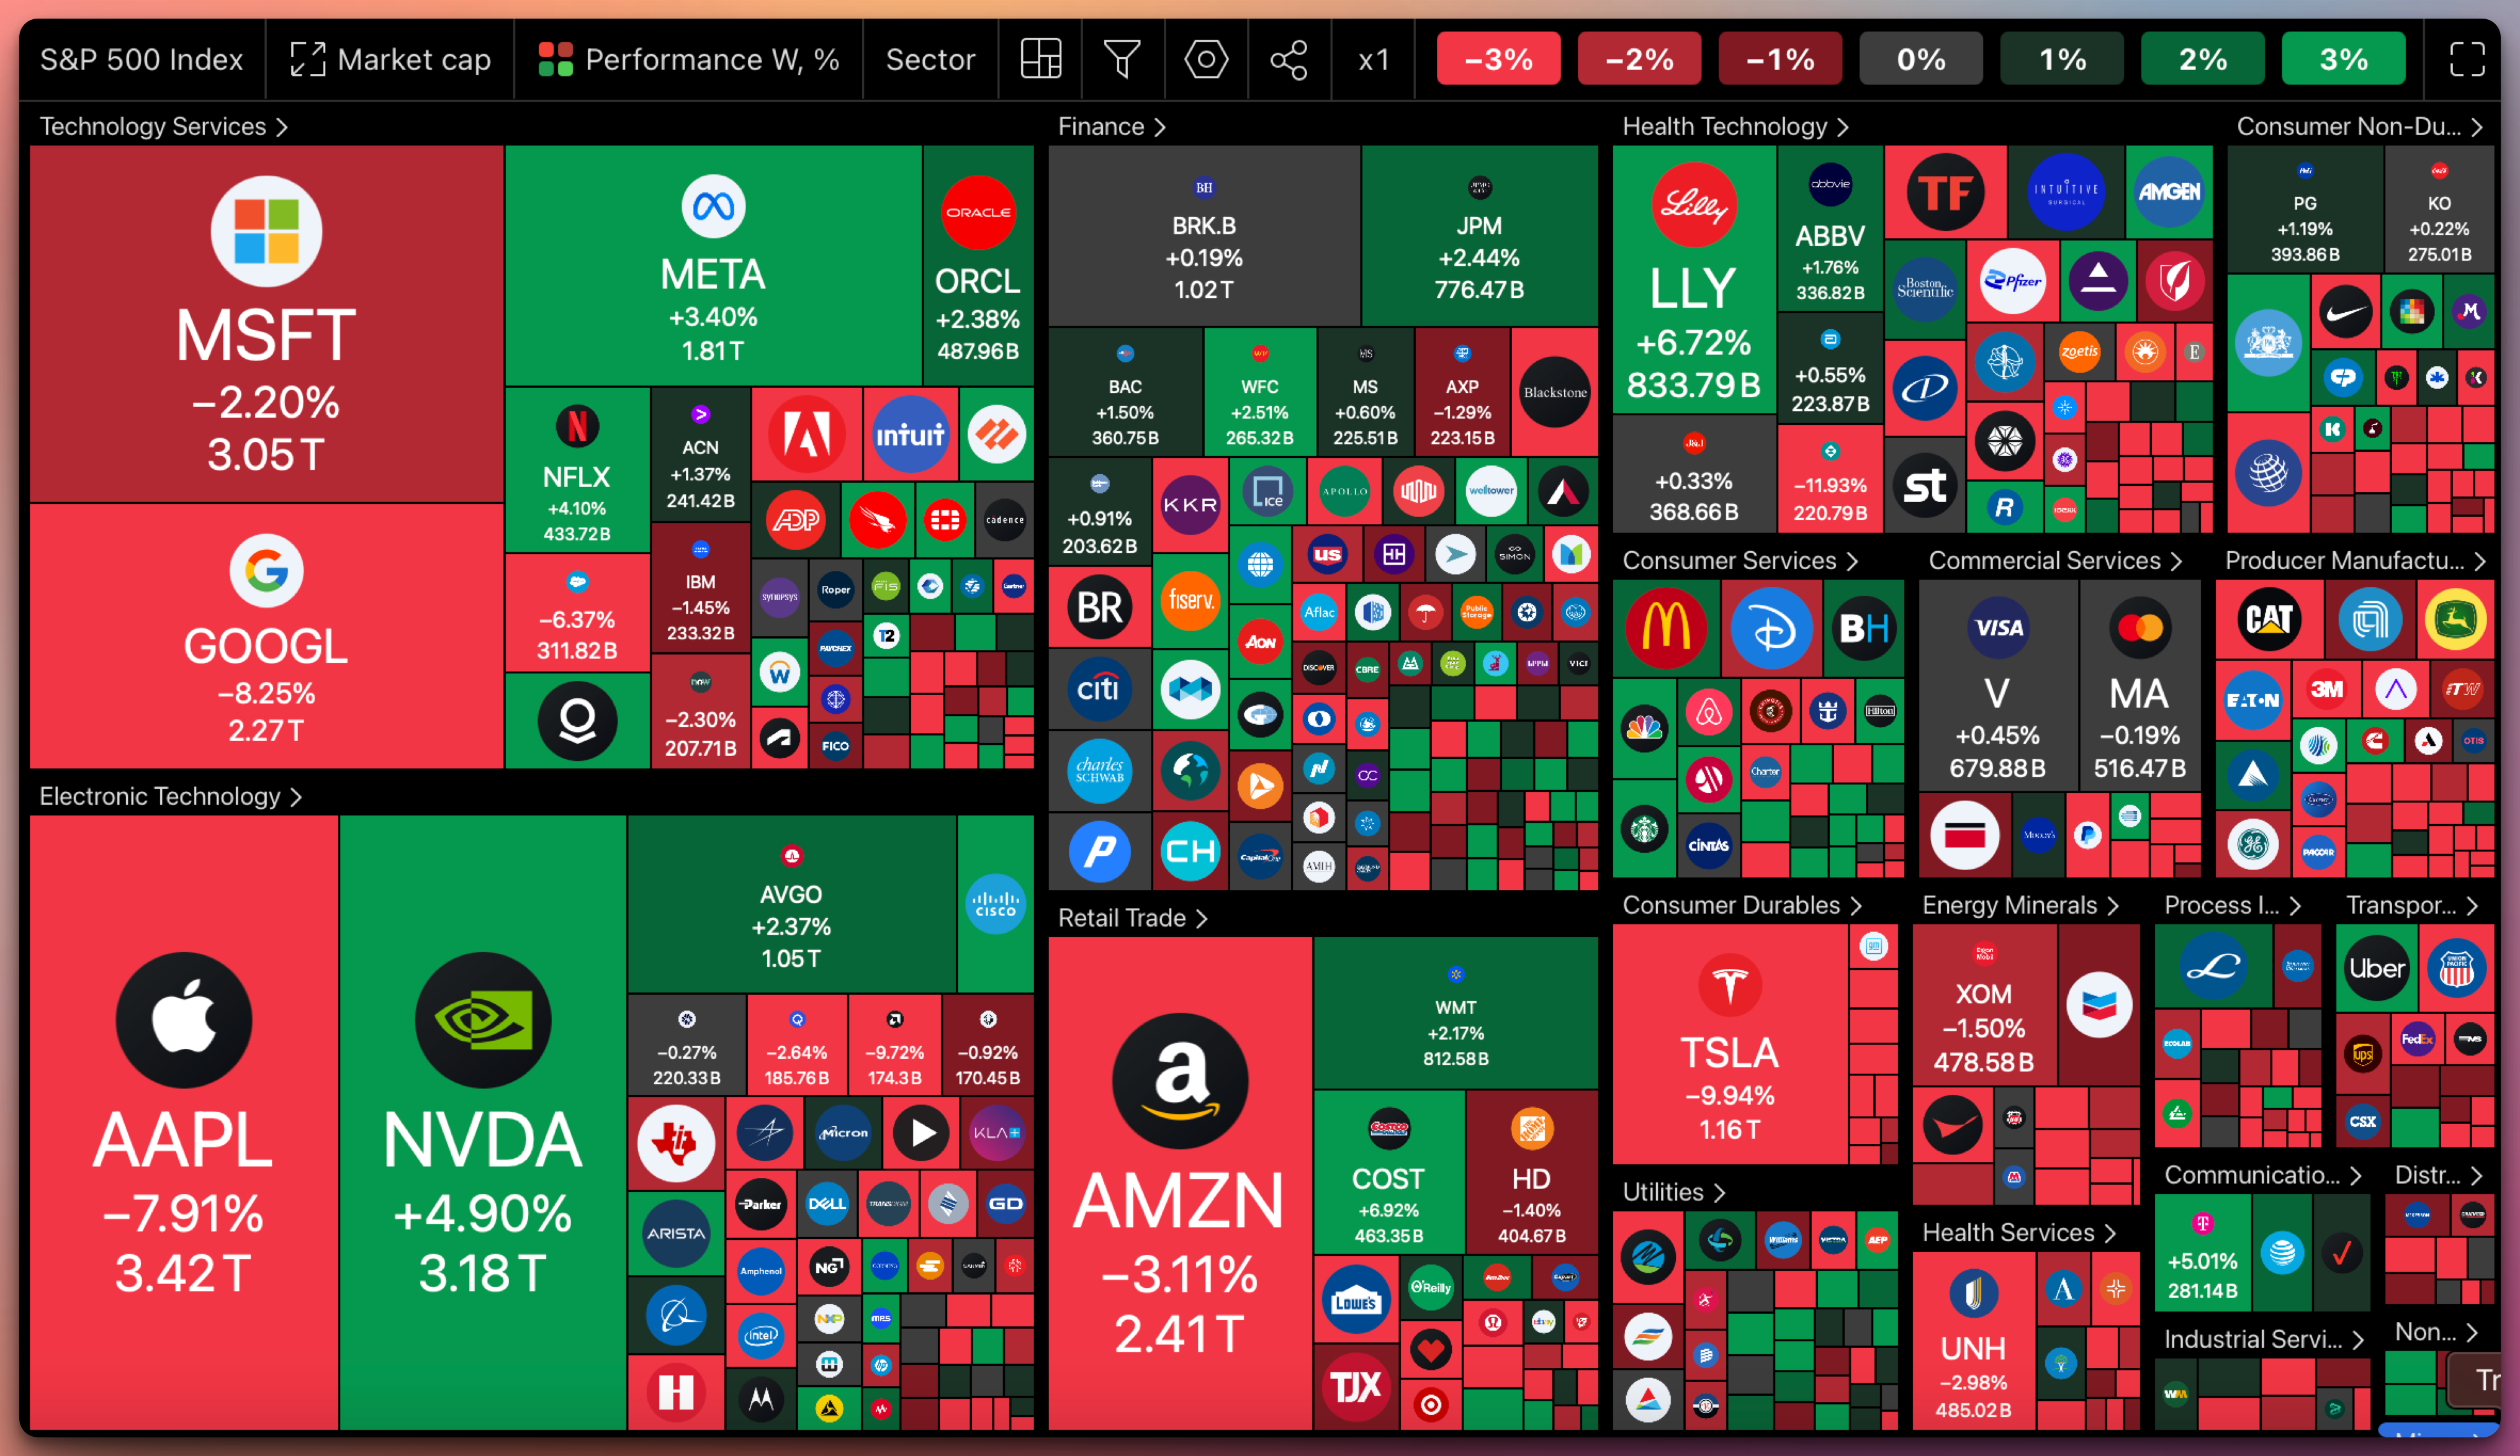
This graph was generated by our friends at TradingView. Did you know you can get 60% off the Premium plan forever, even though it's not Black Friday?
Excel data:

Our friends at TradingView generated these graphs. Did you know you can get 60% off the Premium plan forever, even though it's not Black Friday?
*Also, the chart above shows precisely why you need the Premium TradingView plan in your life. Plus, being able to monitor 8 graphs simultaneously while running complex indicators on them in parallel. Look into this:
SPY Technical & Macro Paradox Analysis
SPY Technical Overview (Last 30 Days)
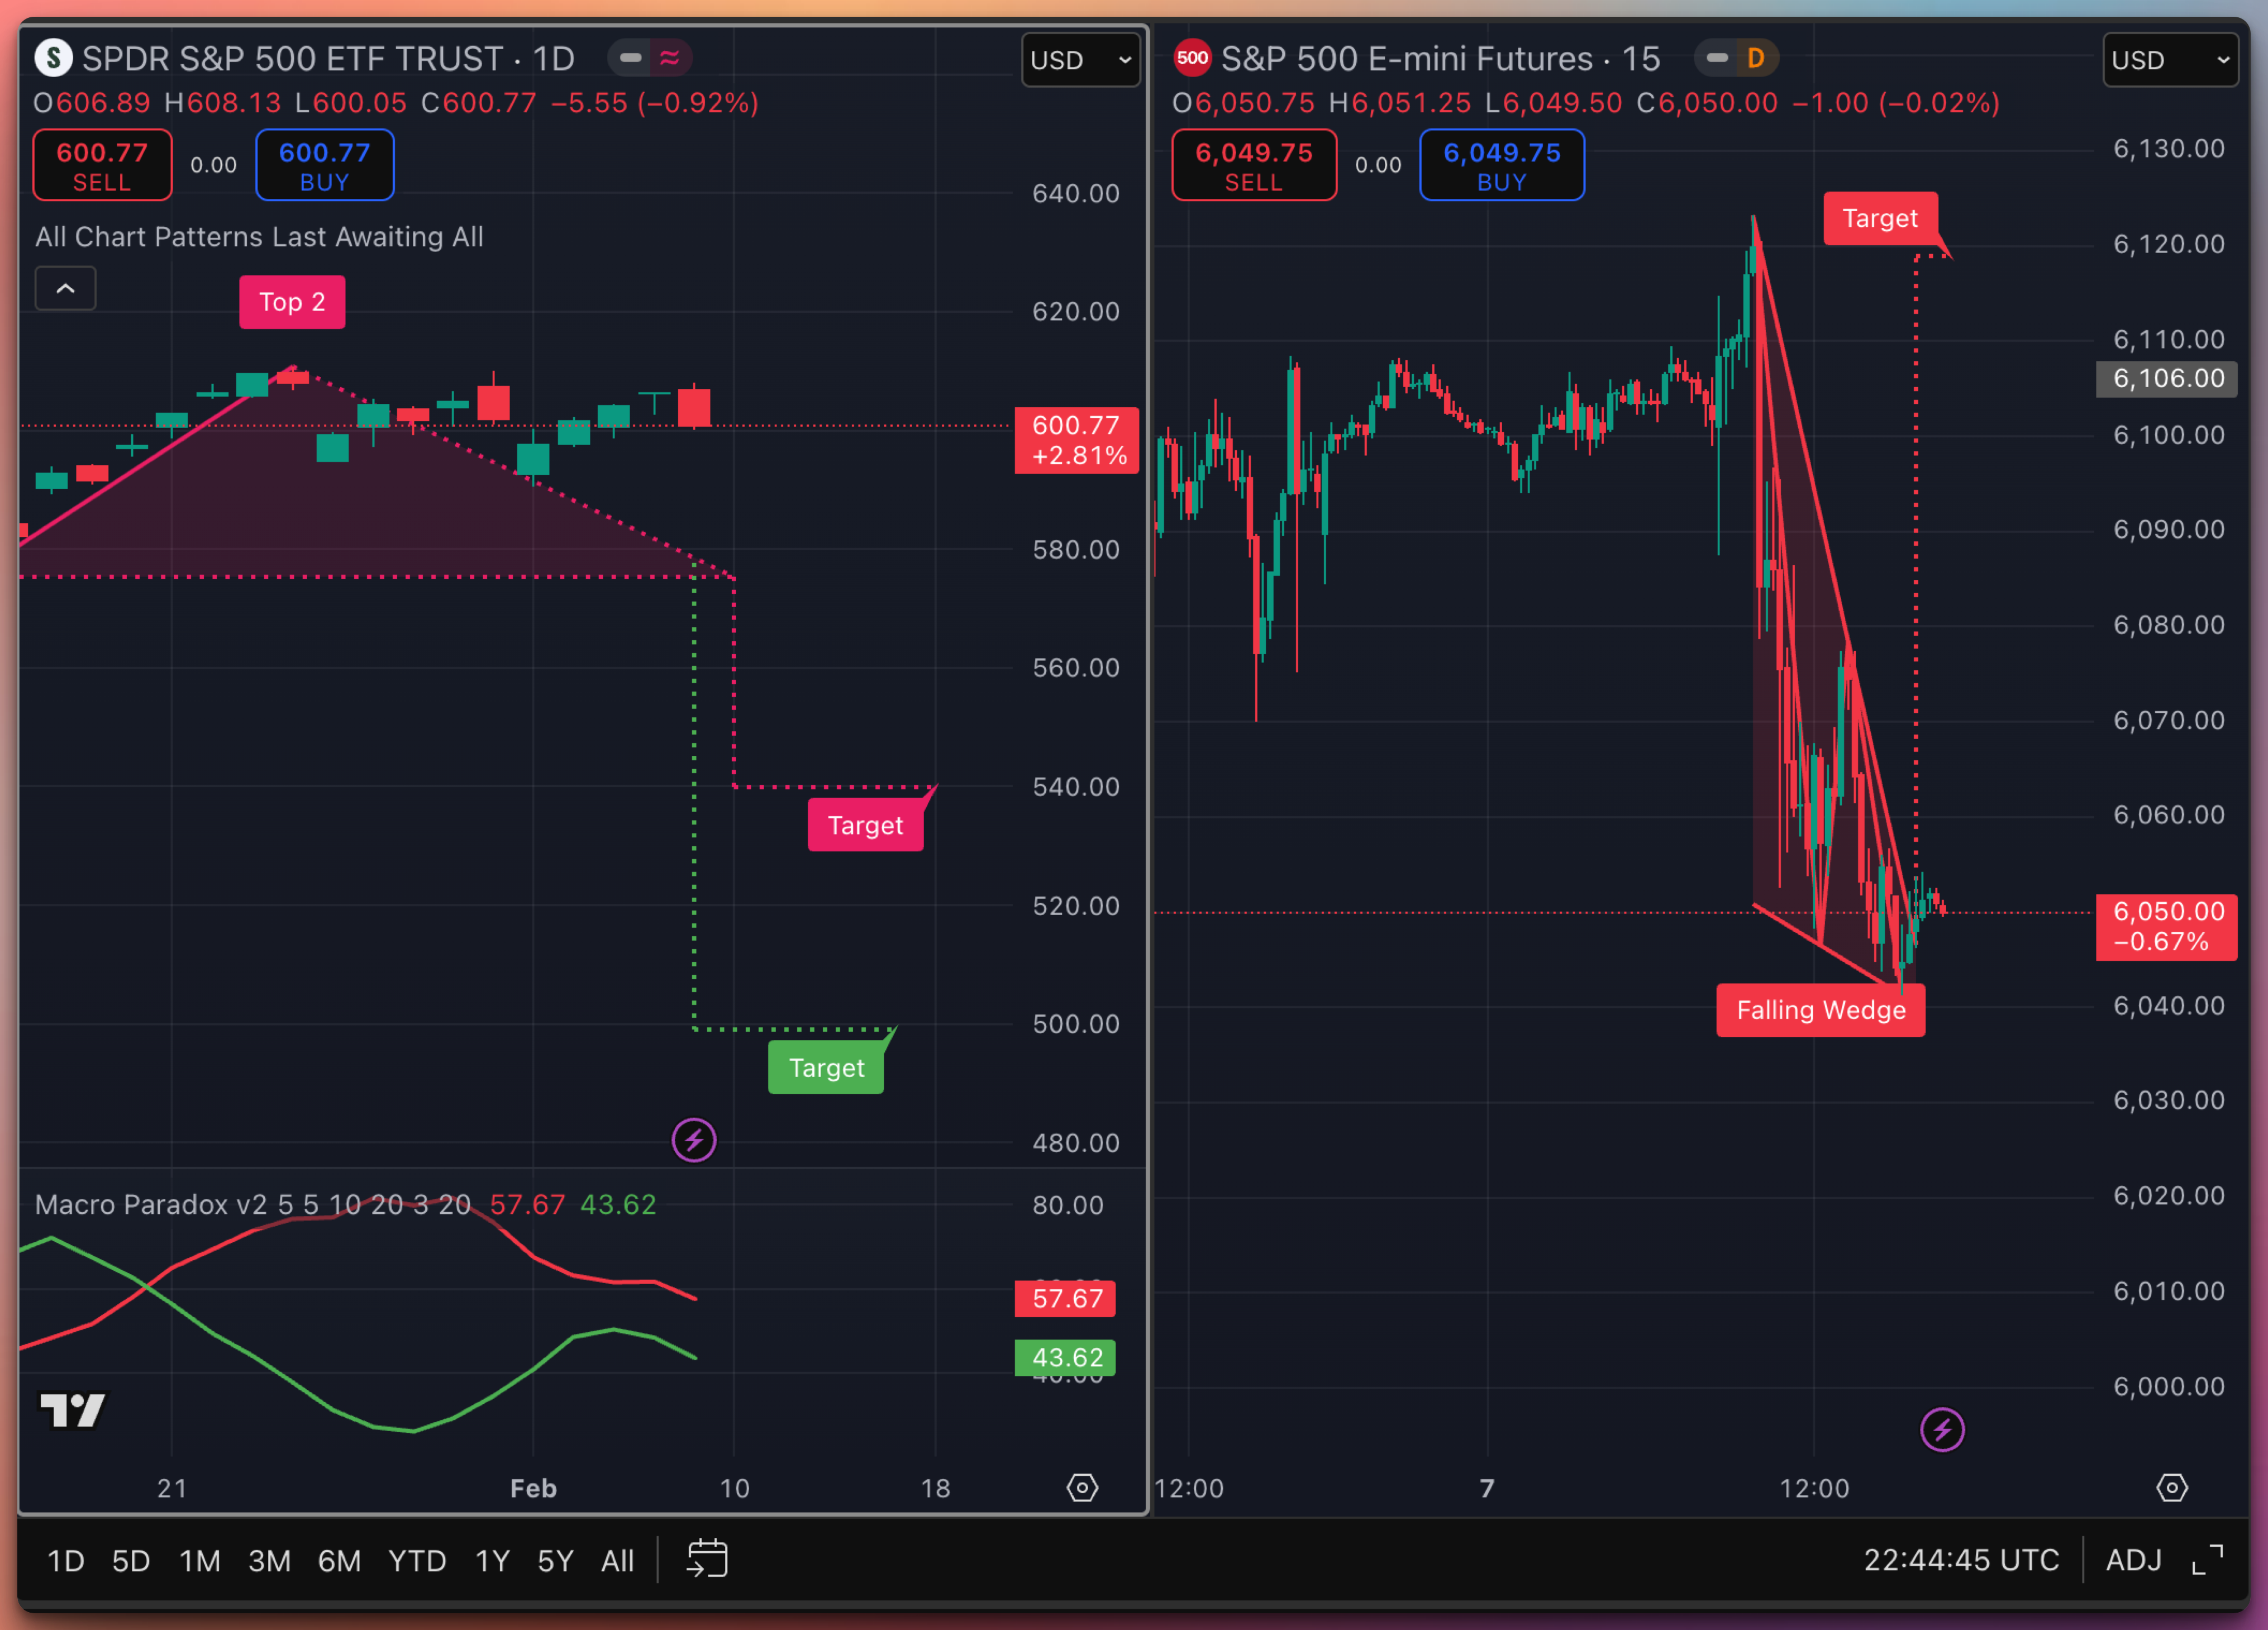
Consolidation & Potential Pivot: Over the past month, SPY has oscillated around the ~600 handle (per the chart’s custom scaling). Price attempted a new local high before rolling into a sideways-to-slightly-lower consolidation.
Falling Wedge Formation (Short-Term): On the 15-minute chart, SPY appears to be carving out a falling wedge. This pattern traditionally indicates a bullish bias if confirmed by a breakout above the wedge’s upper boundary. Any push beyond ~605–610 (short-term resistance) would validate this formation.
Macro Paradox Indicator
Leading by 4–7 Days: The Macro Paradox has historically demonstrated a ~70–80% reliability in anticipating SPY’s broader moves.
Green vs Red Lines:
Green Rising = Bullish Outlook within 4–7 sessions.
Red Rising = Bearish Outlook within 4–7 sessions.
Current Reading: The green line is curling upwards while the red line is flat-to-declining. This typically projects a bullish tilt heading into mid-February.
Upside & Downside Targets
Upside Targets:
Short-Term: ~605–610, aligned with the top of the falling wedge and near-term resistance.
Intermediate: ~620+ if momentum accelerates and the wedge fully resolves upward.
Downside Risk:
A failure to break out above the wedge could see SPY retesting support zones near ~590, then ~580.
Below ~580, algorithmic selling pressure might drive a sharper correction toward ~540 or lower (per the pink “Target” levels on the daily chart).
Final Thoughts
Bullish Bias: Supported by the Macro Paradox’s rising green line and a classic falling wedge setup.
Risk Management: Monitor the wedge’s upper trendline (short-term) and keep an eye on the Macro Paradox’s red line for any unexpected turn upwards.
Caution: Despite the bullish signal, volatility can spike if macro catalysts (rate decisions, economic data) surprise.
Disclaimer: This analysis is purely educational and not financial advice. Always consider multiple factors and your own risk tolerance before making trading decisions.
*Macro Paradox is available for free here

Please send feedback and ideas using comments, PMs, or email. I answer all emails and PMs personally. There is no personal assistant BS here.
And, as always — stay informed — and do your own due diligence,
May the LORD Bless You and Your Loved Ones,
Jack Roshi, PhD, Applied Mathematics at MIT
Lead Quant and Board Member, Sabre Capital Group
Opinions are my own
Weekly Market Recap
The week ended February 7, 2025, was defined by acute tariff uncertainty, mixed economic data, and robust corporate earnings. U.S. equities faced early declines after President Trump’s announcement of steep tariffs on imports from Canada, Mexico, and China—with a 25% rate on North American goods (later postponed for Mexico) and 10% on Chinese imports—triggering volatile market swings. Economic reports delivered a mixed picture: January’s job growth of 143,000 fell short of expectations amid upward revisions for prior months, while consumer sentiment hit a seven‐month low at 67.8, signaling inflation concerns.
Earnings season proved resilient, with more than three-quarters of S&P 500 companies surpassing consensus estimates, driving an average fourth-quarter earnings growth of 16.4%—well above the pre-season forecast of 11.8%. In fixed income, treasury yields declined (the 10-year yield fell to 4.49% from recent highs), and safe-haven demand pushed gold above $2,900 per ounce. Global markets delivered a similarly nuanced picture: European equities advanced modestly, the Bank of England cut rates by 25 bps amid slowing growth, and Japan contended with a stronger yen as its central bank signaled further tightening.
Read on for the detailed, day-by-day analysis and overall advanced commentary—available exclusively behind our paywall.
Detailed Day-by-Day Analysis:
Subscribe to access the full advanced breakdown below, featuring in-depth technical commentary, granular market data, and strategic insights.
Keep reading with a 7-day free trial
Subscribe to The Stock Insider to keep reading this post and get 7 days of free access to the full post archives.